Dr Samantha Pendleton
Clinical Informatician
Engineer of data, ontologies, and clusters. Thrower of pots, controllers, and eggs.
Fashun: an R Shiny App of fashion trends
I want to start by saying fashion (or fashun) is whatever you decide - whether that is double denim or choosing two completely different patterns. I enjoy fashion, and for me, this is an outlet for expressing oneself.
Introduction
Setting the scene: I have just handed in my PhD thesis and although I have a job, my evenings are no longer full of writing.
In my job, I have been developing a data dashboard and found I’ve enjoyed using Shiny.
So, I decided I would expand my skills in these evenings: looking at data handling, dashboards, and text analysis.
Shiny- a package for building interactive web applications.
Methodology
I used Python for data extraction and data engineering. I used R version of Shiny for app development.
Using Google Trends via pytrends and a Twitter API via tweepy, I created the app that looks at fashion trends, correlations, and sentiment analysis.
- The Trends analysis includes Google data relating to fashion and the correlations, plus seasonal observations.
- Sentiment analysis of Twitter posts - that included terms relating to fashion - compares the opinions of various topics.
Google Trends
Using pytrends, I collected data with category 185 “Fashion & Style” from the category list. Date from the beginning of 2019 until July 2022.
from pytrends.request import TrendReq as UTrendReq
pytrends.build_payload(values, cat=185, geo="GB-ENG", timeframe=f'2019-01-01 {date.today()}',)
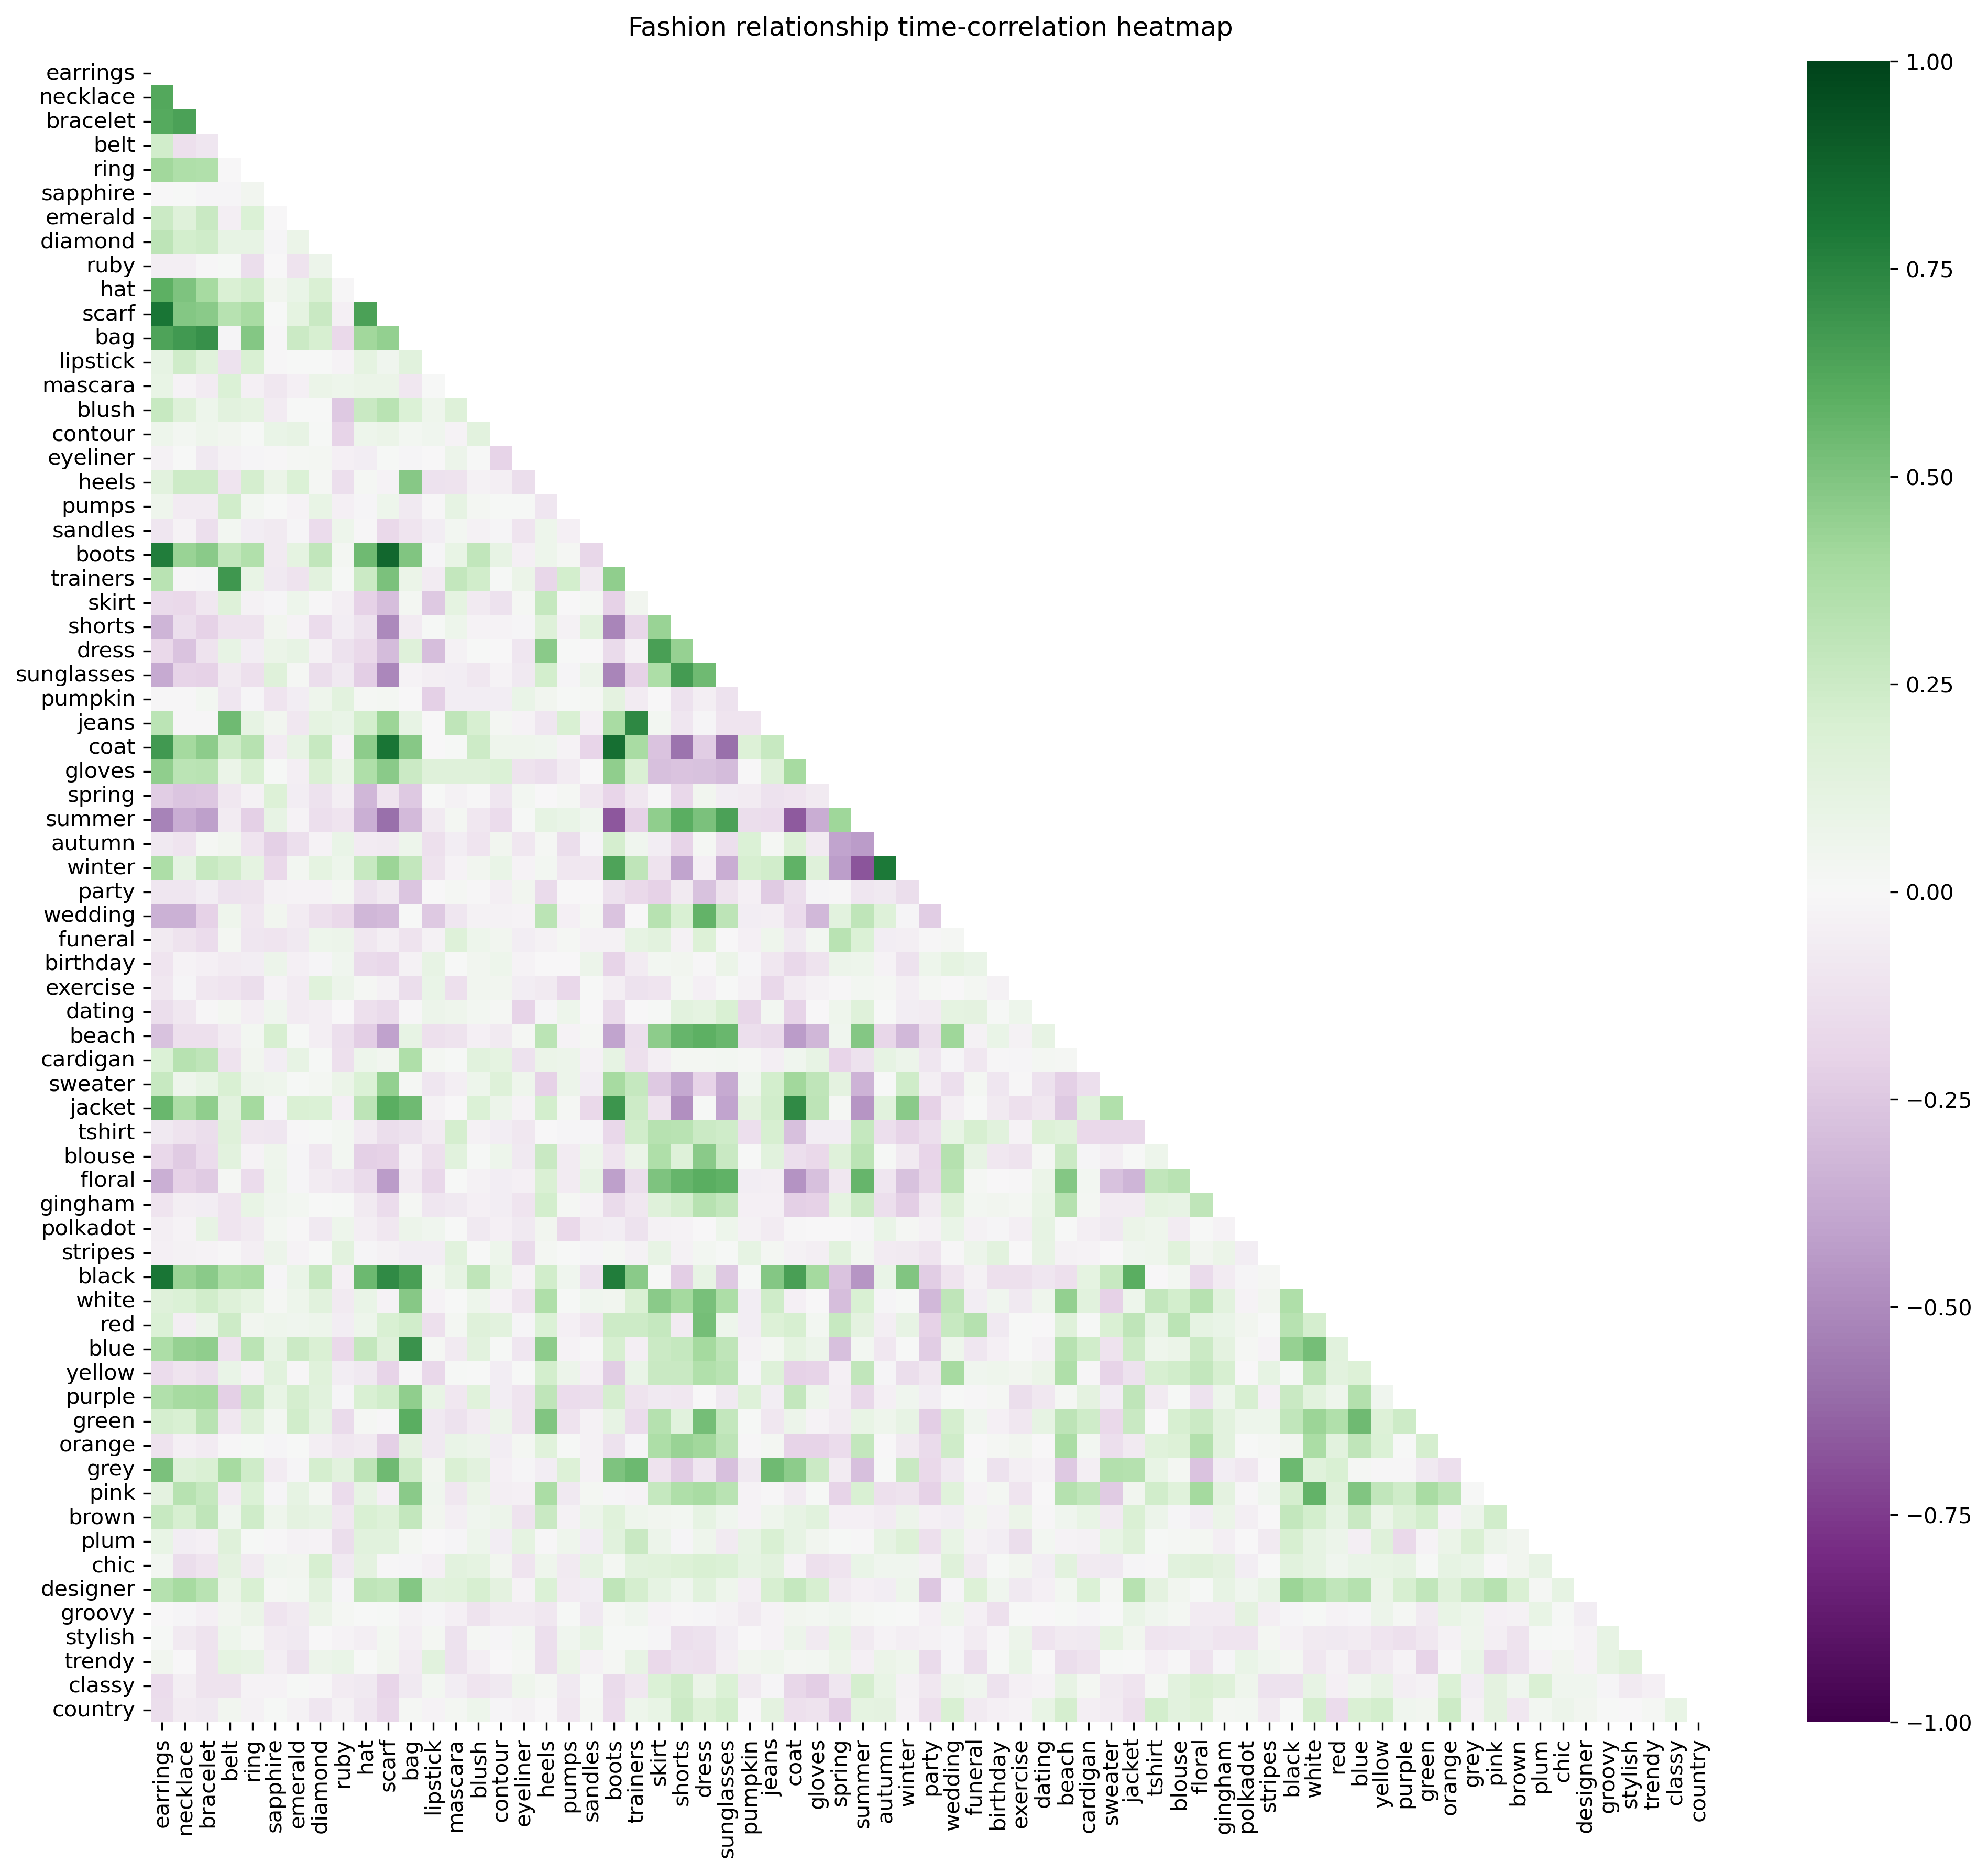
Figure: Correlation matrix of trend occurrences between terms of interest. Green represents positive correlation, white neutral, and purple negative. For example: earrings and necklace are highly correlated, both a fashion accessory.
We can see some fashion correlations from the above matrix, such as: accessories (earrings and necklace) and seasonal (winter, coat, boots, scarf). Winter itself correlating negatively with Summer. Correlation can infer semantics (coat and jacket) and indicate synonyms. Some interesting correlations include a positive relationship between earrings and black; and a negative relationship between Summer and bracelet & earrings.
| High correlation | Low correlation |
|---|---|
| earrings & scarf | earrings & summer |
| earrings & boots | summer & bracelet |
| earrings & black | shorts & scarf |
| bag & bracelet | sunglasses & scarf |
| winter & autumn | summer & scarf |
| summer & sunglasses | shorts & boots |
| coat & scarf | winter & summer |
| jacket & coat | summer & boots |
| winter & coat | coat & shorts |
| coat & boots | coat & sunglasses |
| winter & boots | summer & coat |
| beach & dress | |
| jeans & trainers |
Below dives deeper of two terms and individual correlations: summer and boots. We can see that summer correlates positively with sunglasses, shorts, floral, dress, and beach (x > 0.5). However, correlates negatively with winter, boots, coat, scarf, and interestingly earrings (x < -0.5).
On the other hand, boots correlate with scarf, coat, black, and more (x > 0.5). Correlates low with terms that summer correlates high with.
| Summer | Boots |
|---|---|
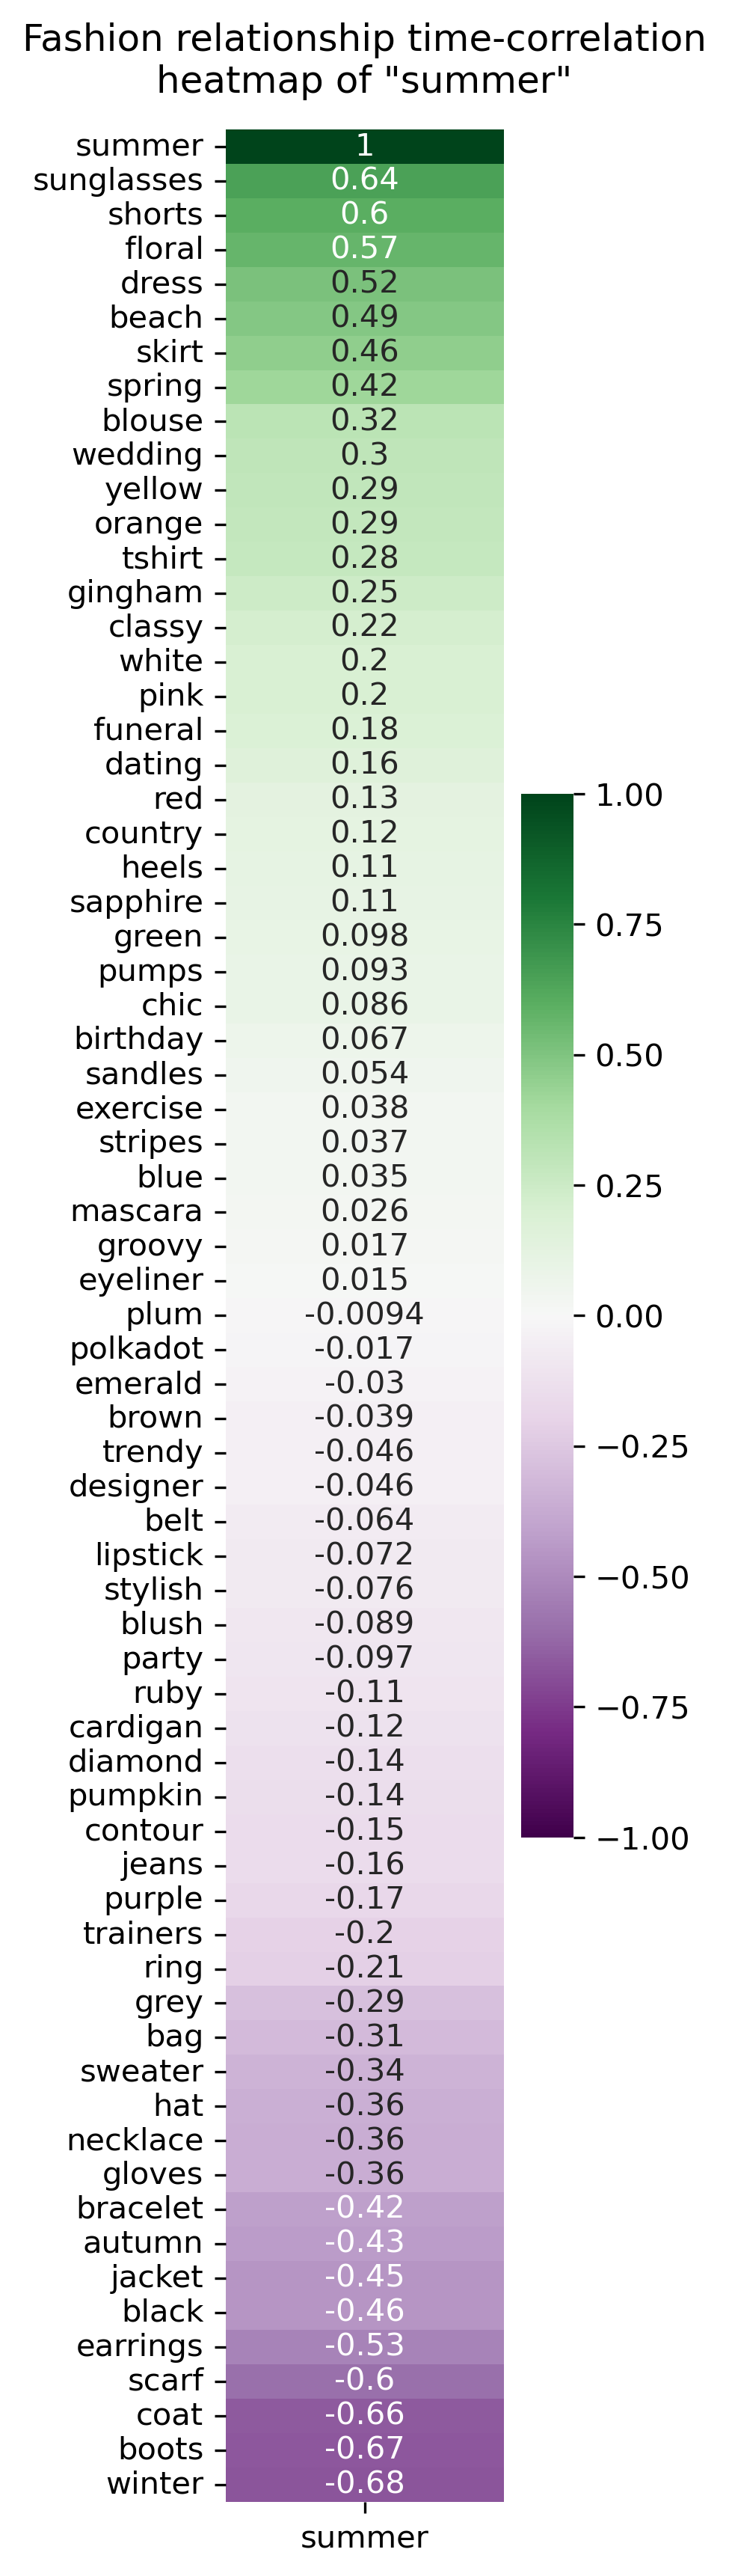 | 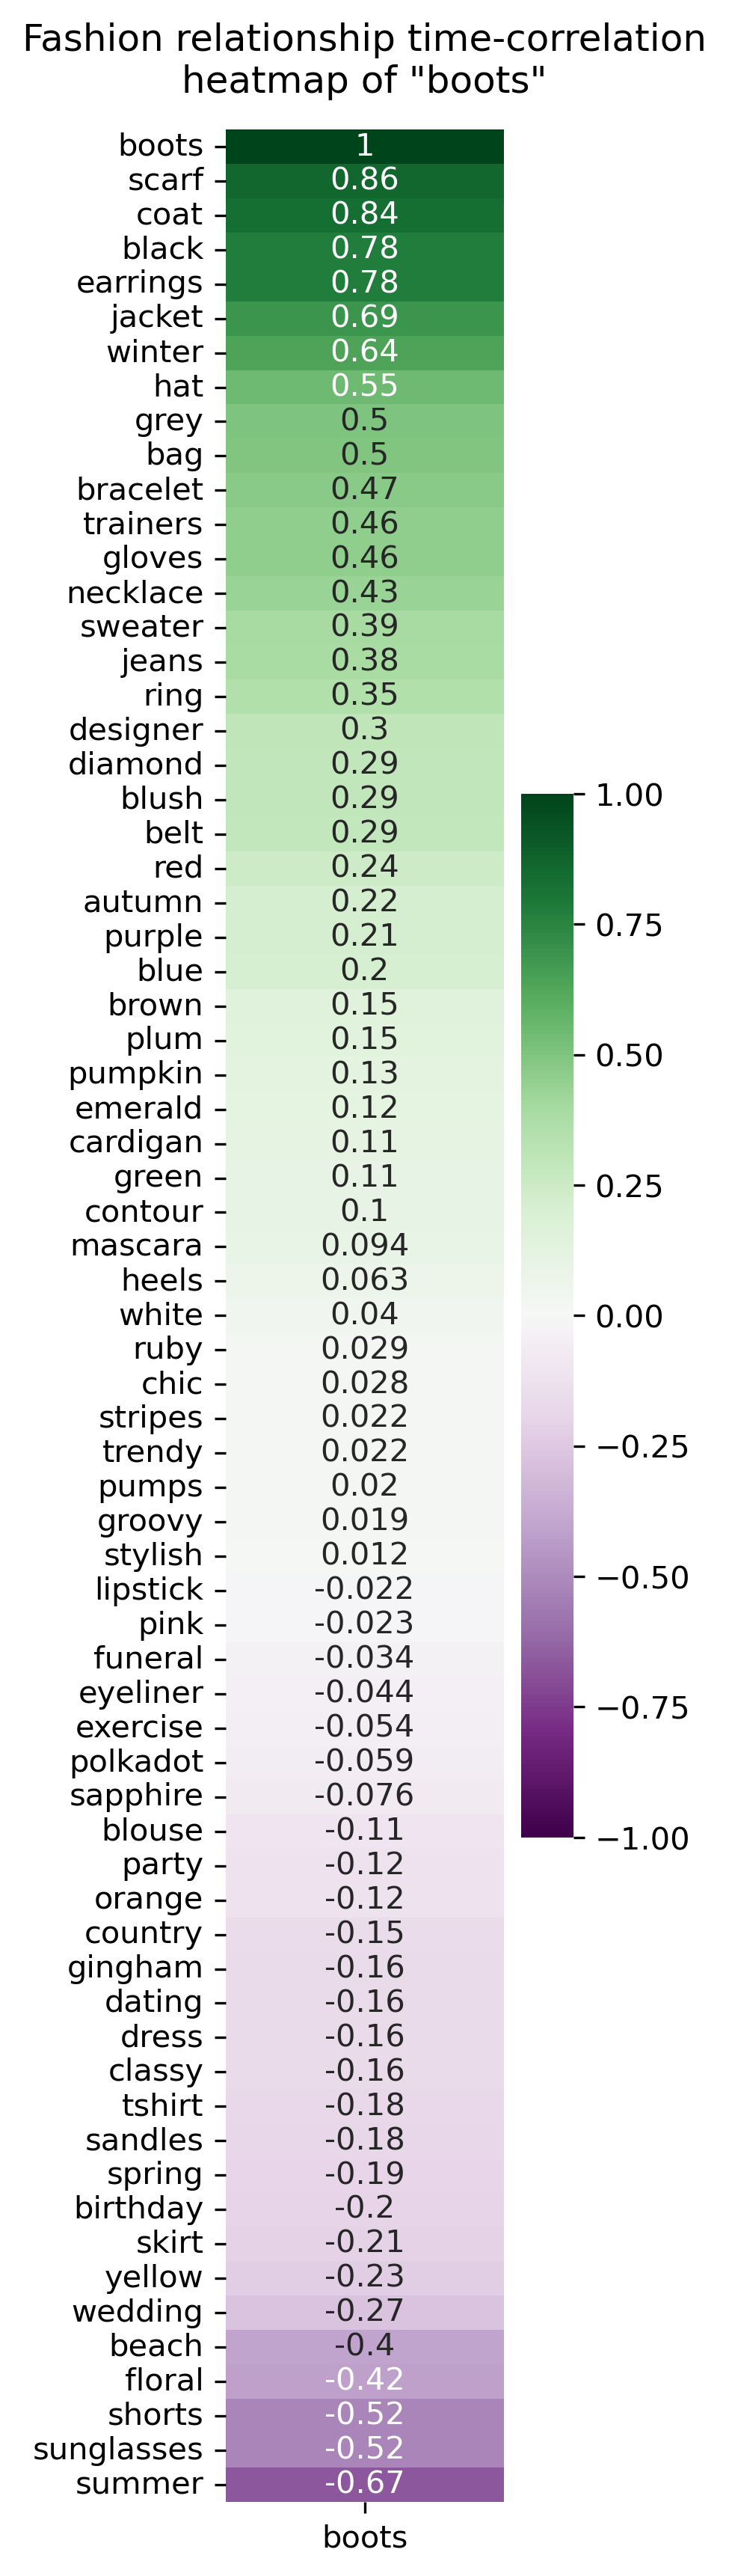 |
Seasonality
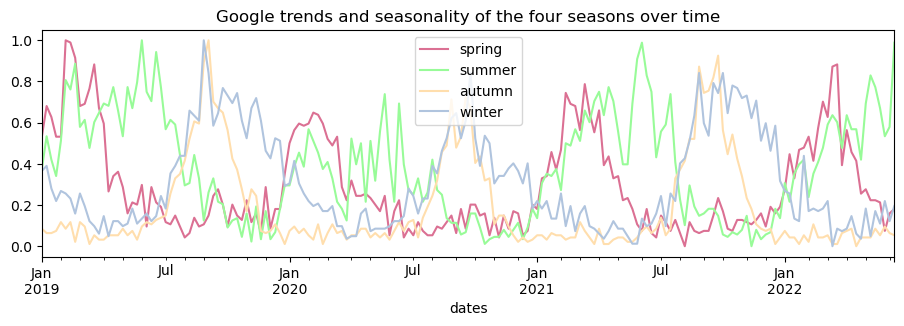
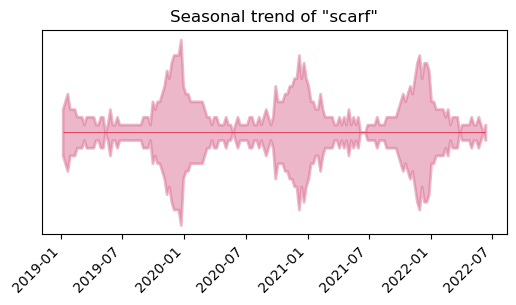
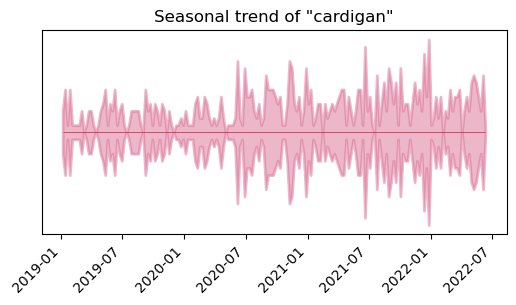
Figure: Longitudinal line plot showing the trend of seasonal terms over the year.
The above plot shows seasonal fashion over time: spring starts to trend in the new year, summer trends over longer intervals, and both autumn and winter start to trend in July (mid-Summer).
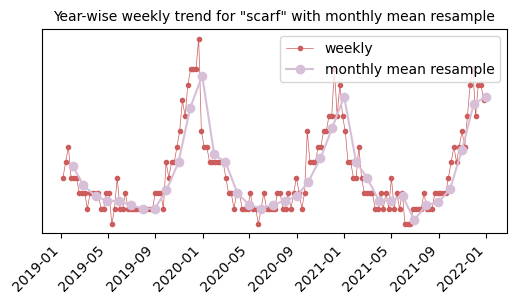
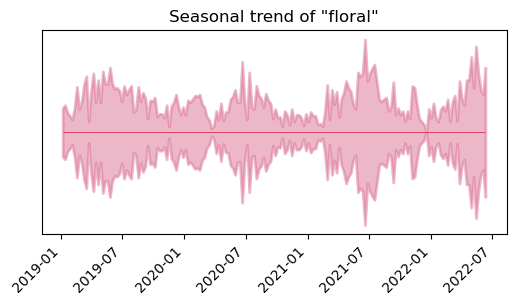
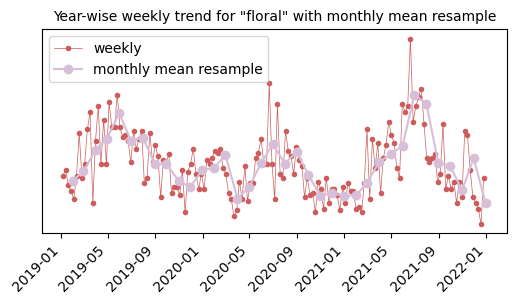
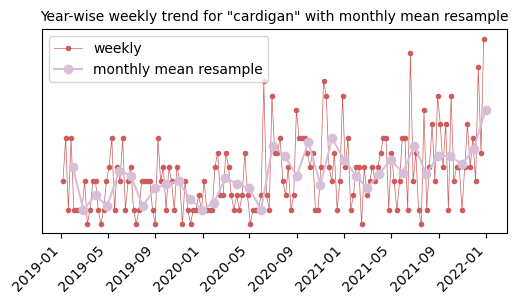
Below are specific terms and their trends both over the year (left) and a weekly average (right). Scarf starts to trend in the autumn and peaks in December. The floral (pattern) trends around the beginning of Summer and there is no obvious trend for cardigan except for peaks in June/July.
| 6-month | Weekly |
|---|---|
 |  |
 |  |
 |  |
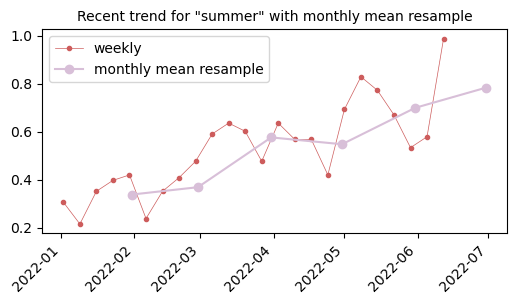
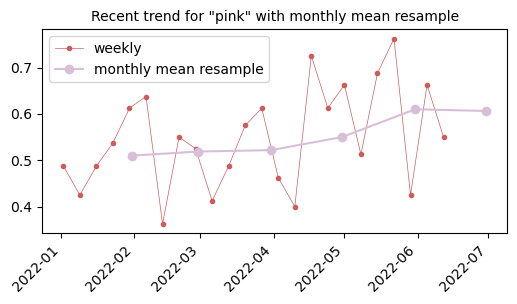
Below represents a visualisation of “upcoming” fashion, specifically within the Summer season, and shows trends from January 2022 to June 2022. As expected, Summer starts to become more popular as the year progresses toward Summer and a somewhat foundation to compare “Pink”. Pink, which was fashionable in Summer 2022, steadily increased over time.
| Upcoming Summer | Upcoming Pink |
|---|---|
 |  |
Twitter Sentiment
Using tweepy I collected single tweets (no replies, retweets, or links) and then used VADER for sentiment analysis as it is a rule-based method pre-trained with tweets.
tweet_search = "lang:en -filter:links -filter:replies -filter:retweets"
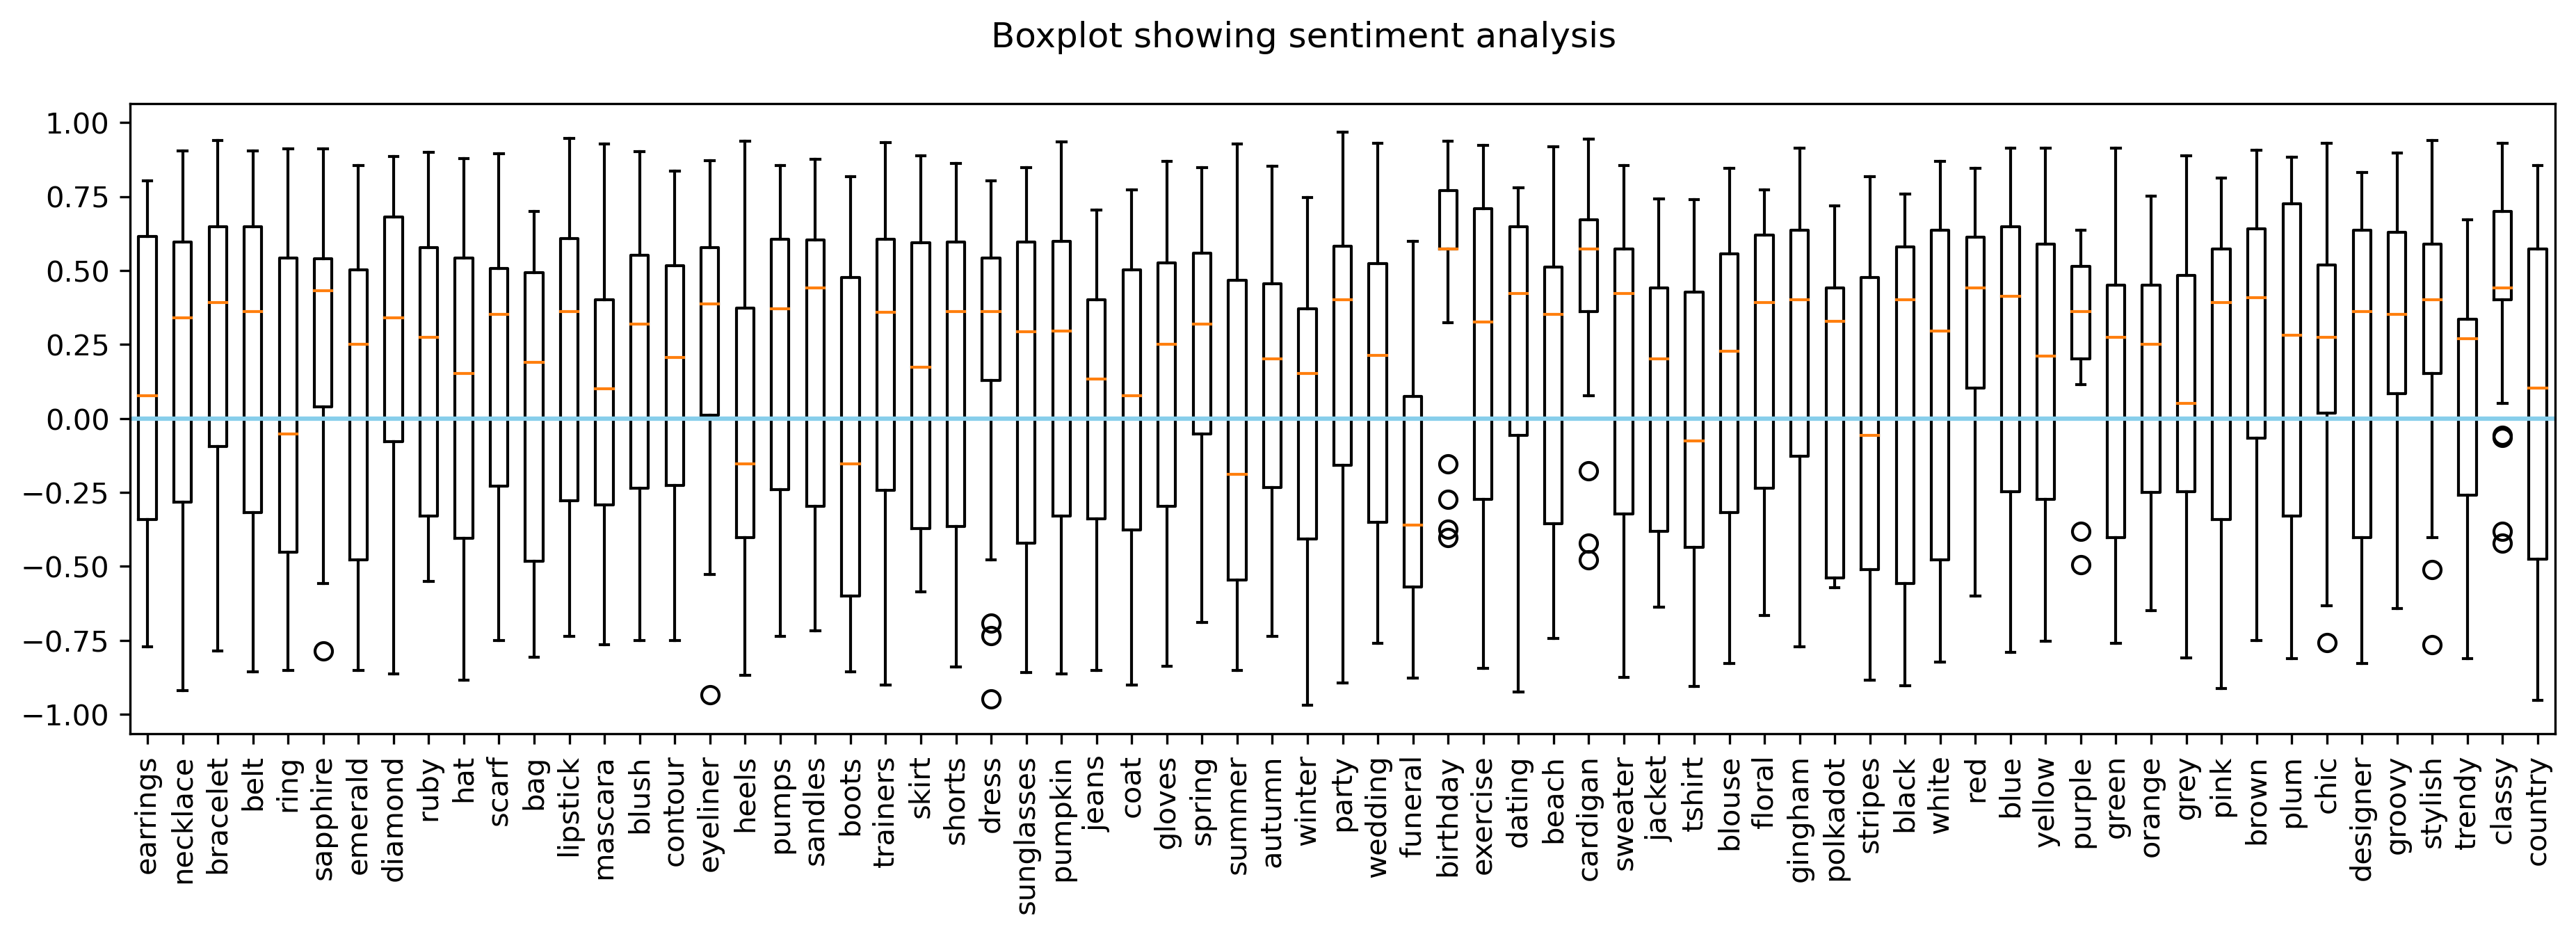
Figure: Boxplots of sentiment scores across all fashion topics.
Looking into categories: in accessories earrings and ring have a lower average sentiment with ring being less than 0 (most neutral). In make-up, mascara has the lowest average sentiment yet remains higher than 0. In patterns: stripes have the lowest sentiment while gingham has the highest average sentiment. Finally, in shoes we see that both heels and boots have a lower average sentiment as footwear - which we know can be uncomfortable.
| Accessories | Make-up |
|---|---|
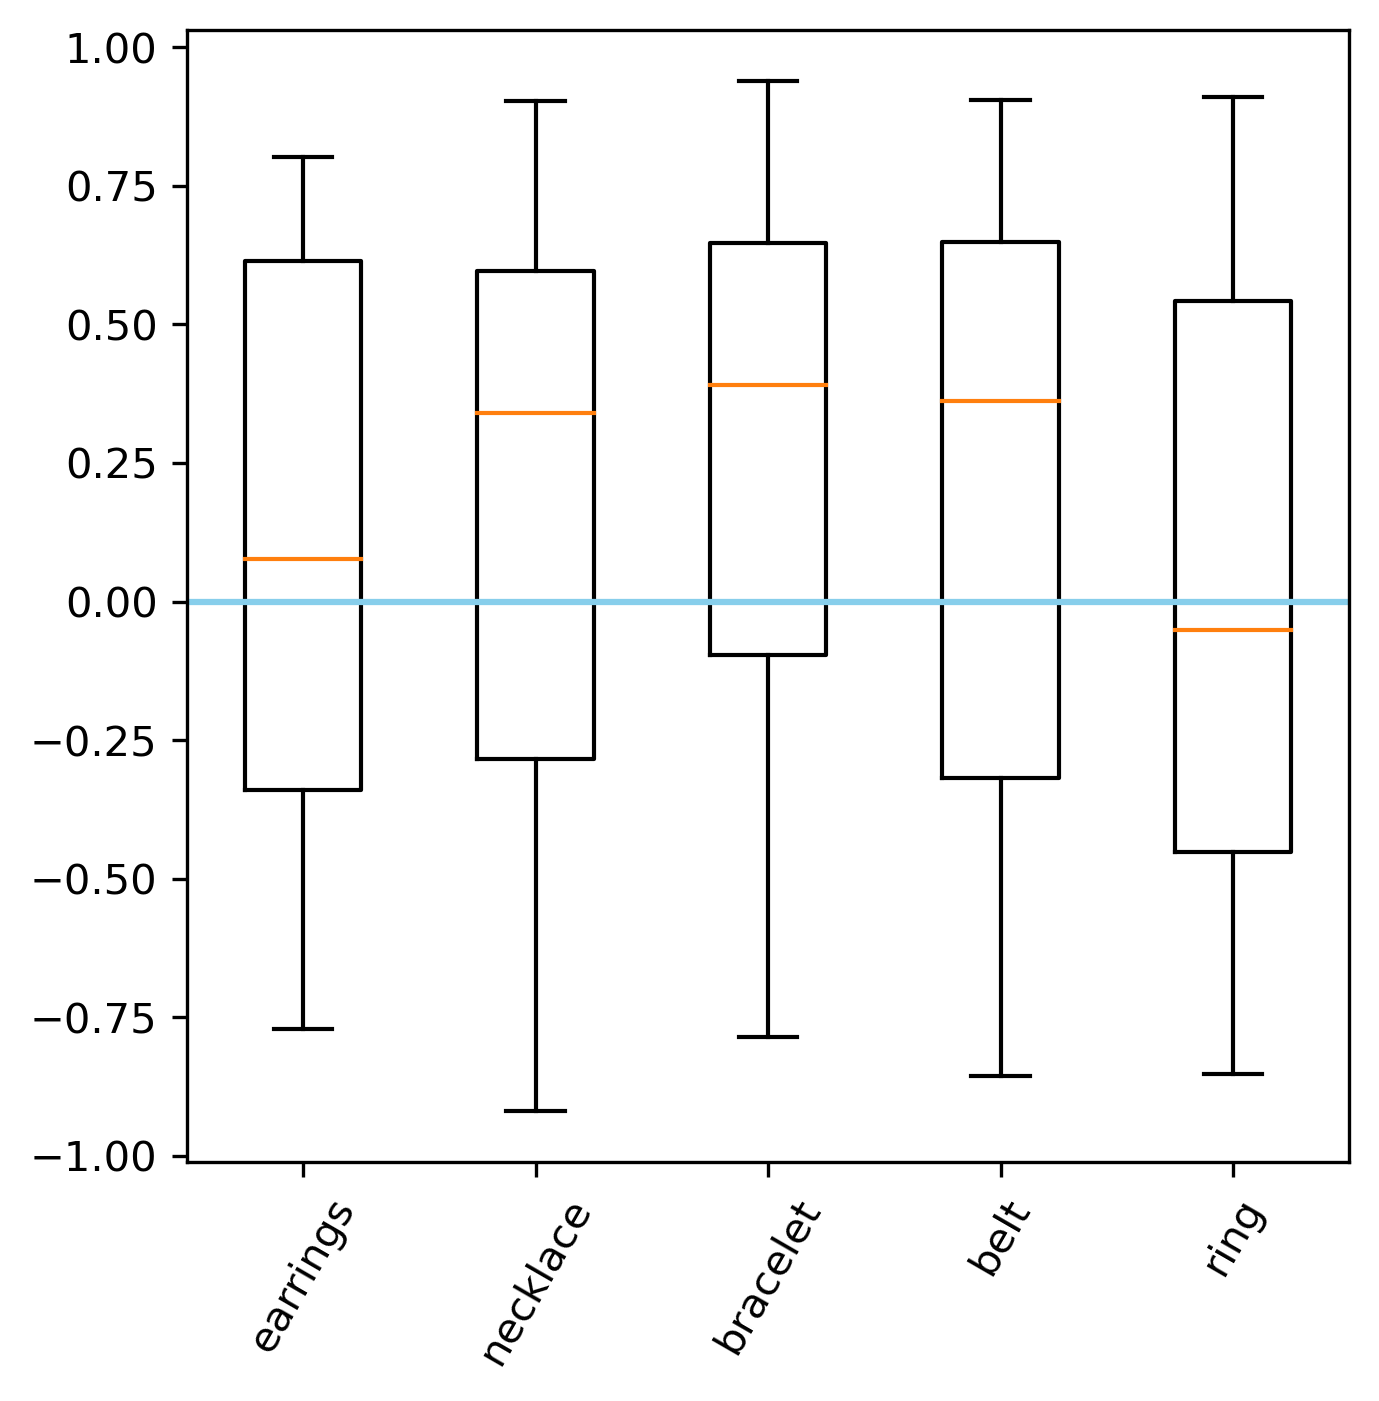 | 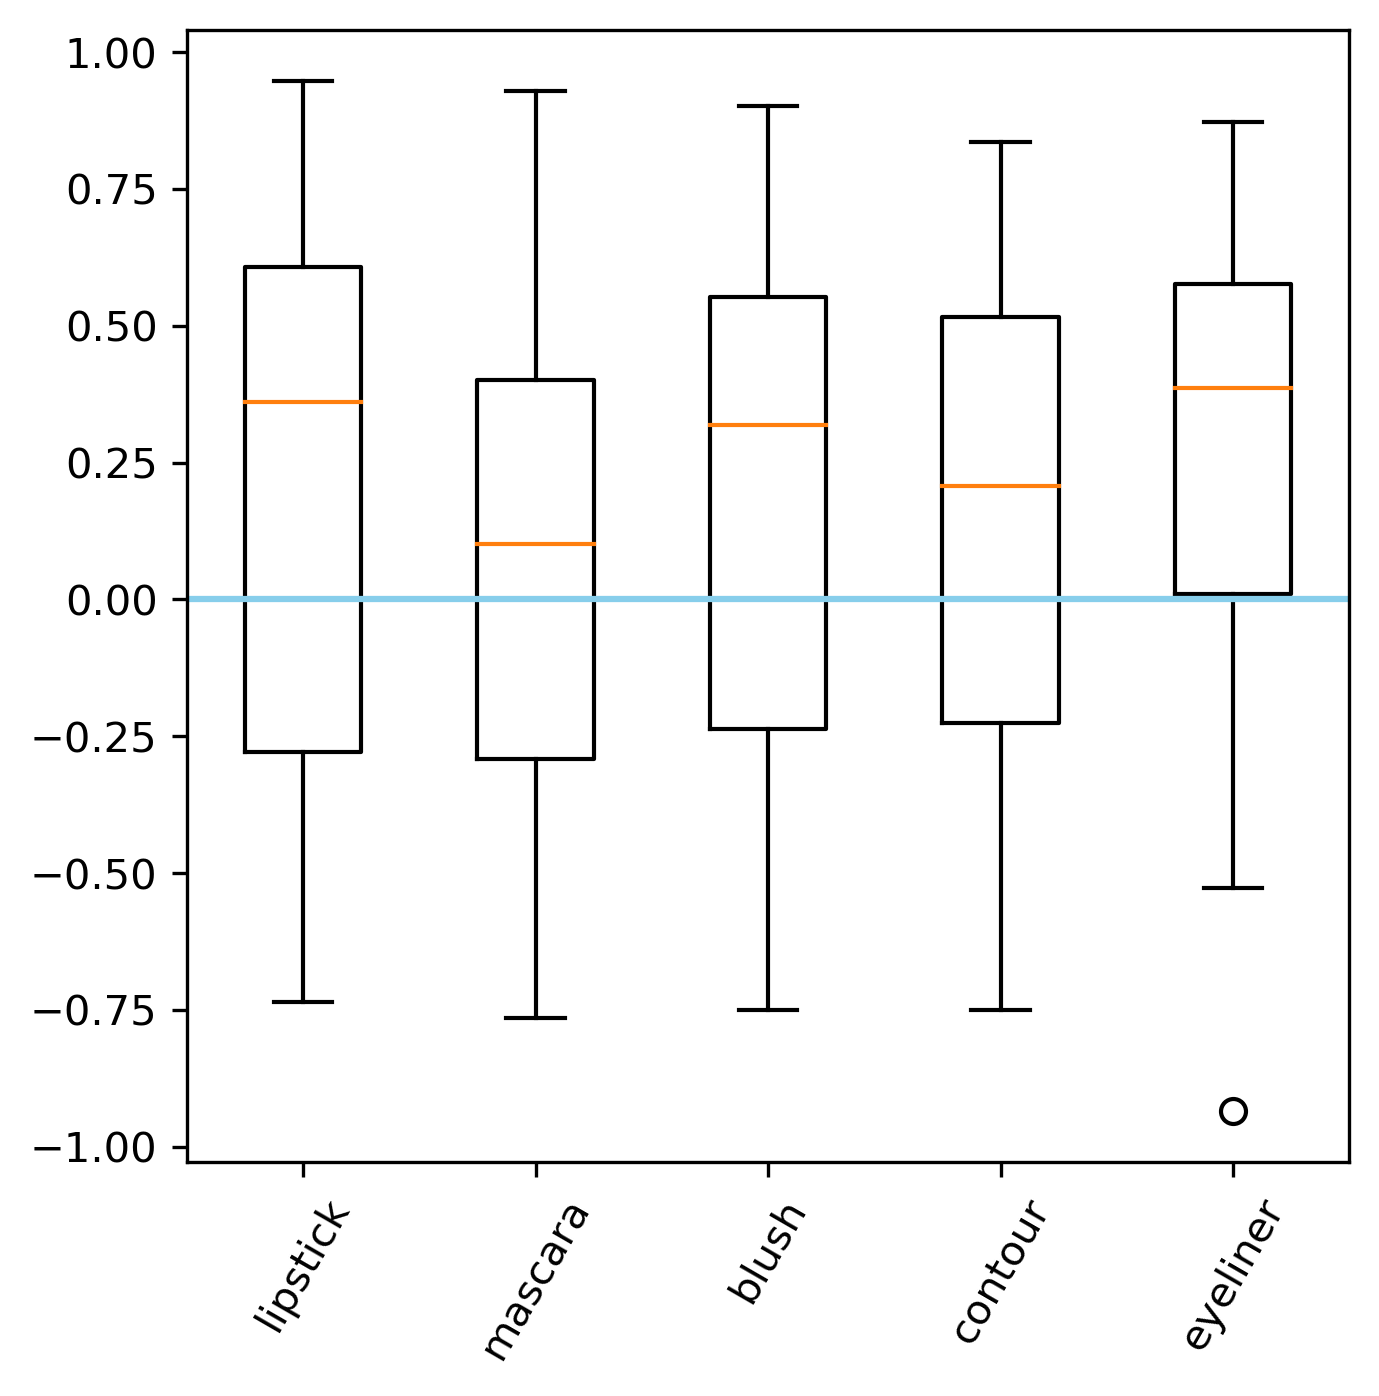 |
| Patterns | Shoes |
|---|---|
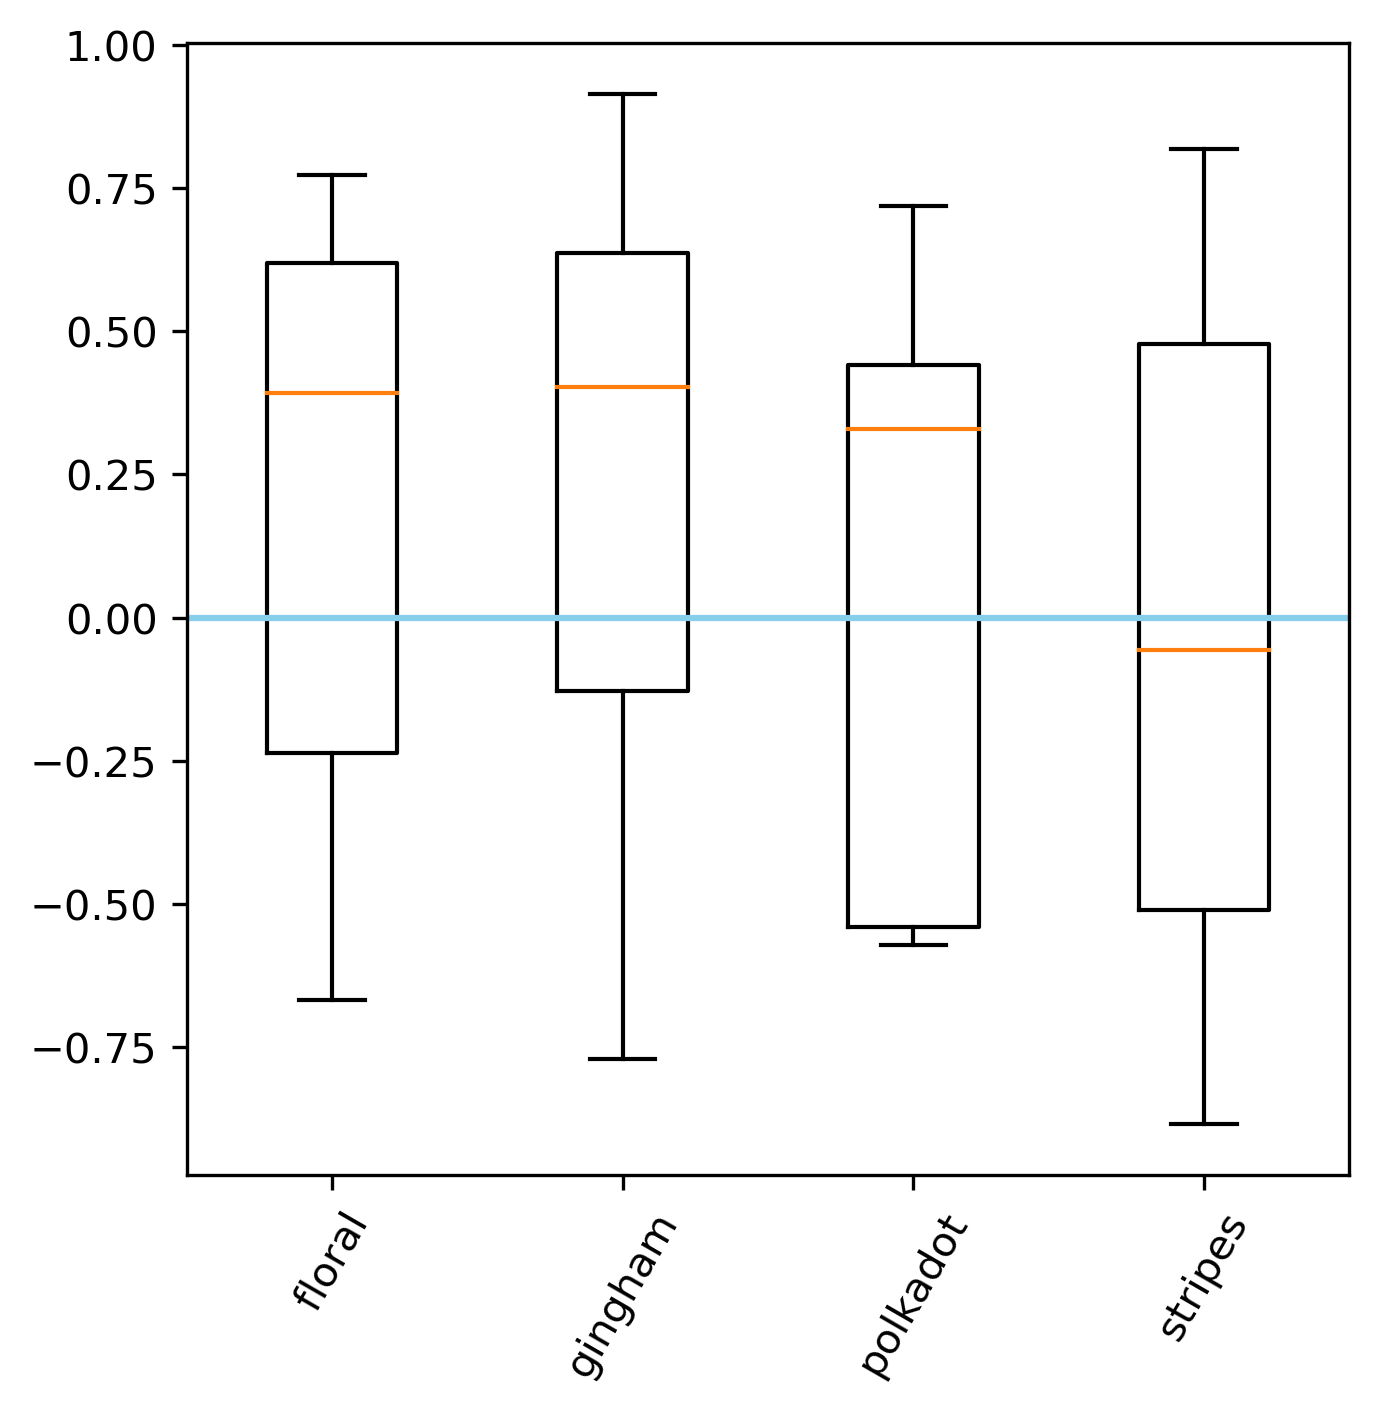 | 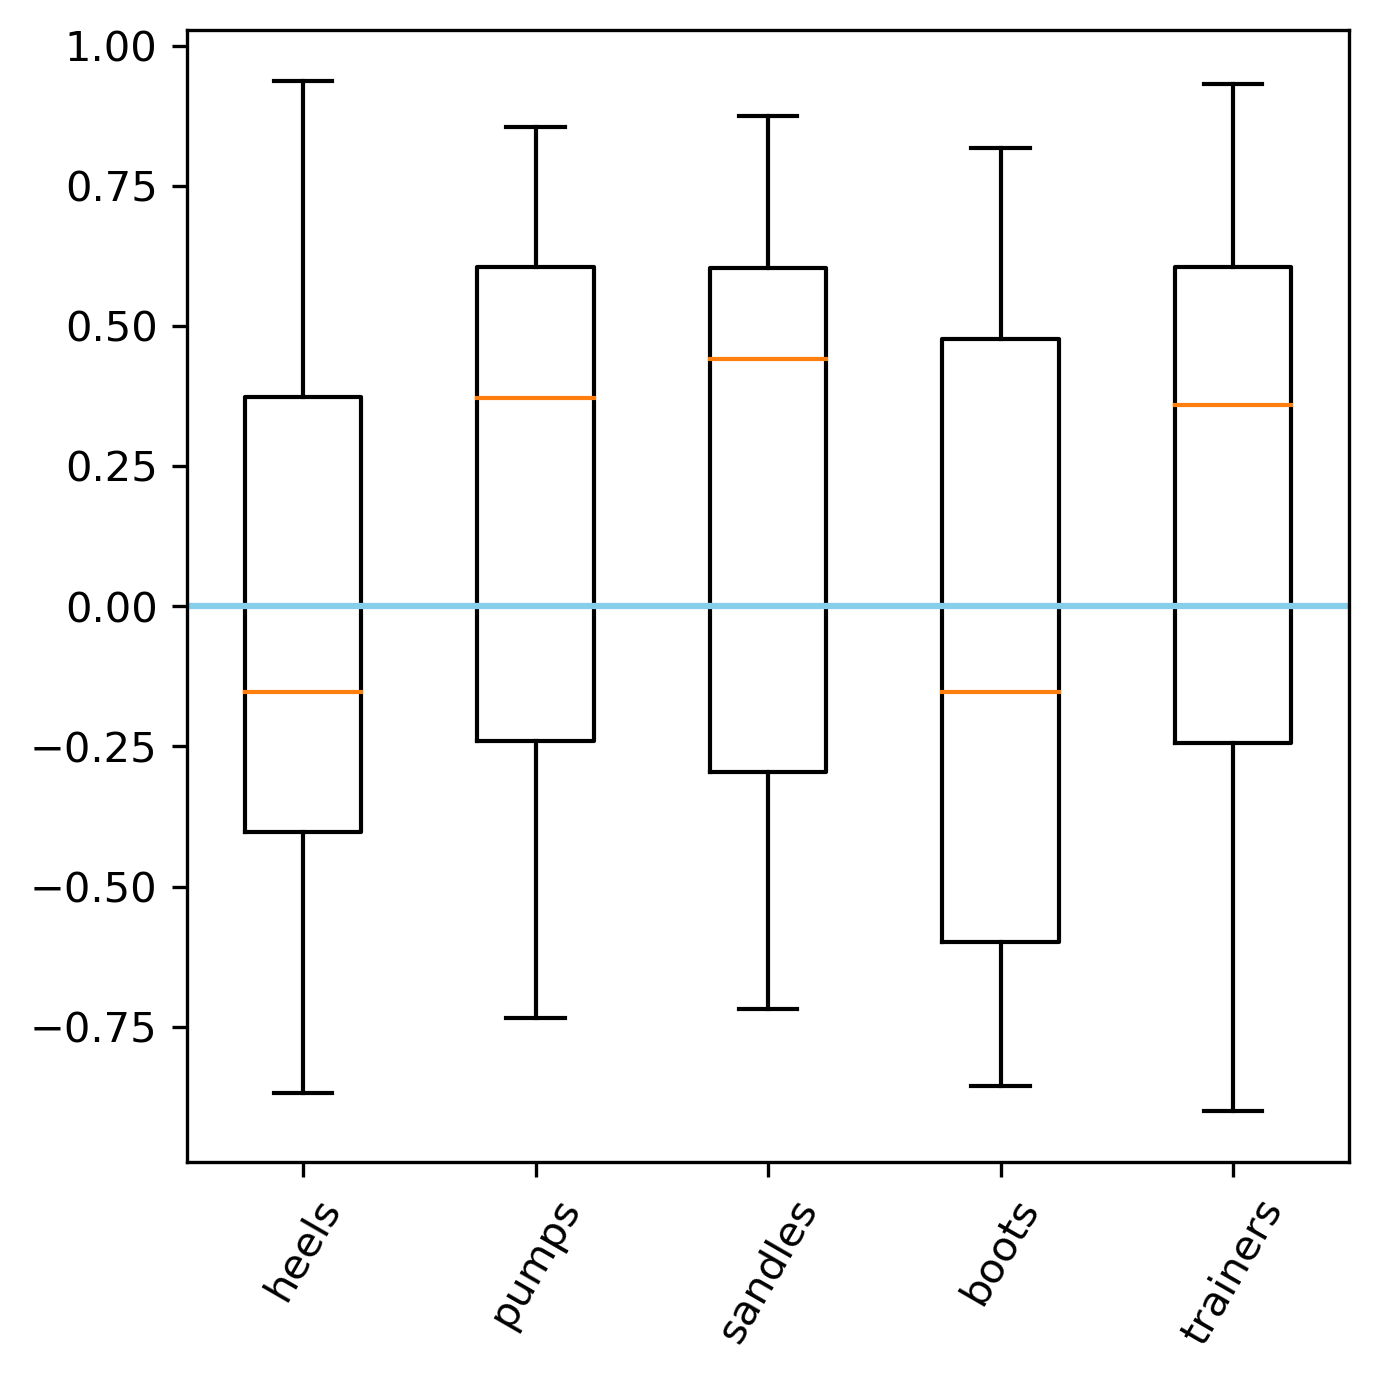 |
Wrapping-up
This project was fun! I had intended to explore the data in more detail and better describe the methods. For example, with the Twitter text output, I would do more investigations and extract out tweets that may be completely irrelevant. So perhaps this post will be expanded in the future!
The code is available on GitHub which includes the data extraction, engineering, and the application code.
As of 2023, Twitter is now X and so the Twitter API code will probably not run. I believe in order to access, one would need to pay/have a subscription.
The App
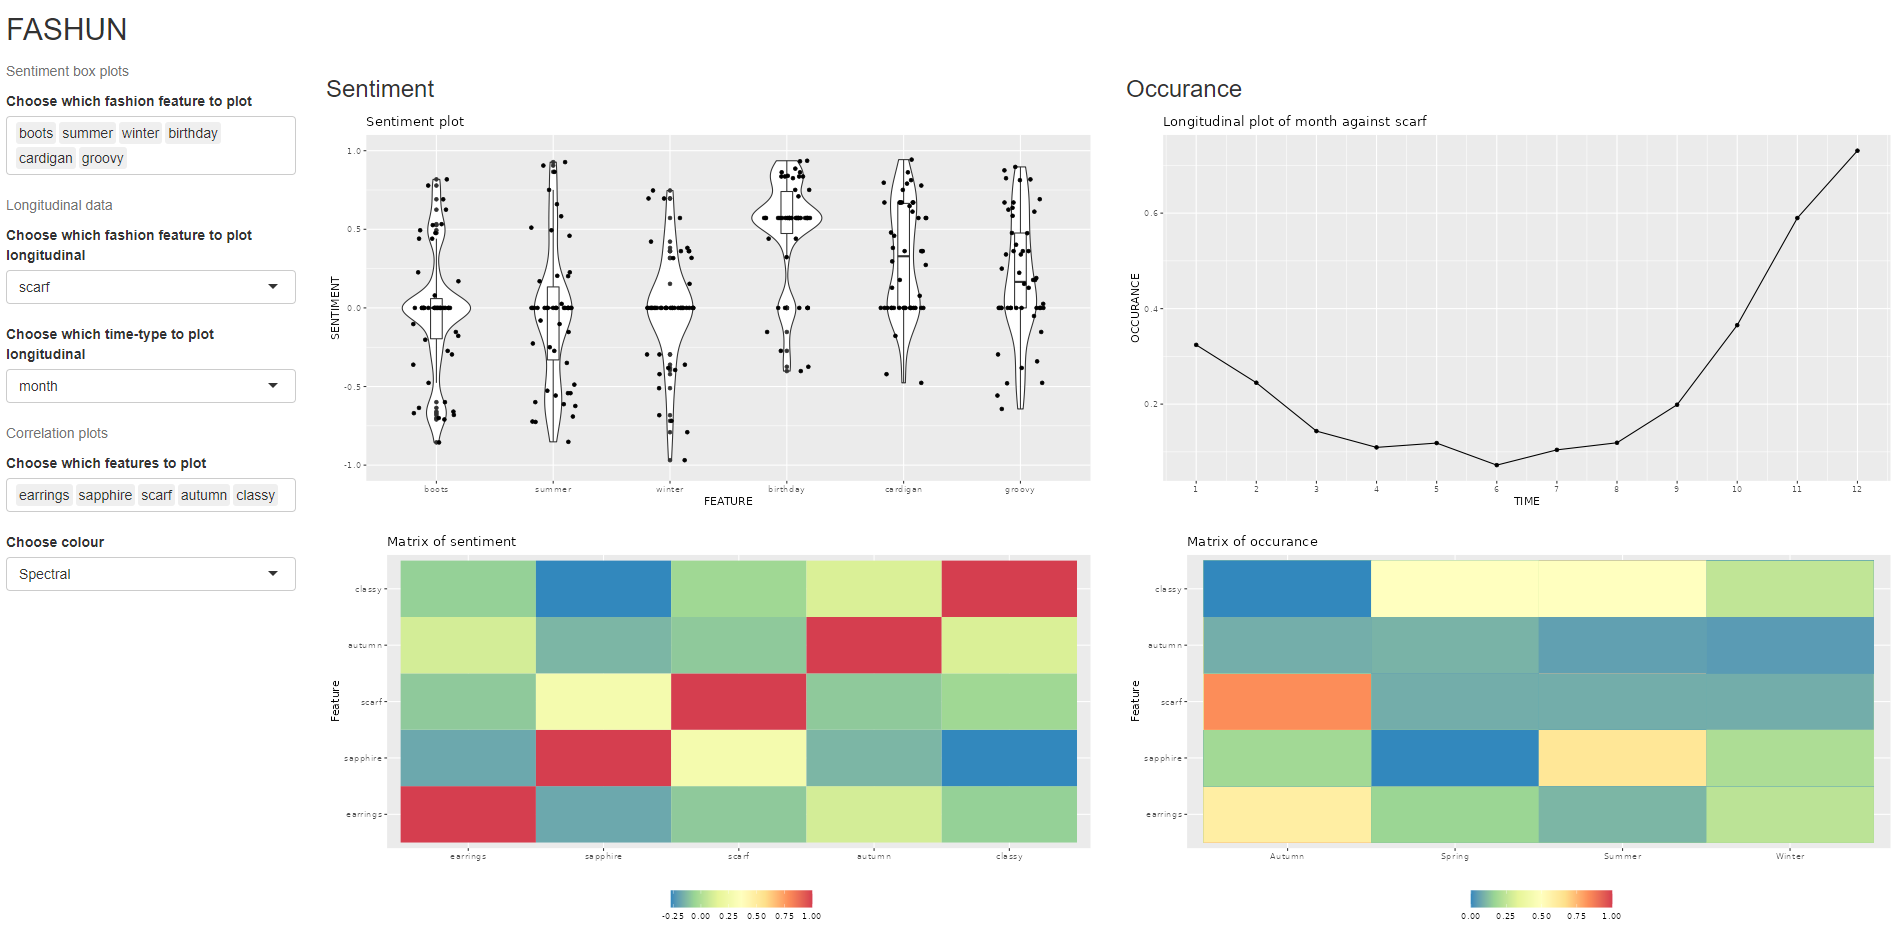
Figure: A screenshot of the Fashun App.
Please do have a little explore - let me know if you find anything interesting!