Dr Samantha Pendleton
Clinical Informatician
Engineer of data, ontologies, and clusters. Thrower of pots, controllers, and eggs.
Were dreams more “out of the ordinary” during COVID (2020)?
Preface
COVID was a wild time and it was almost 6 years ago! It all started January 2020: I was doing my PhD and barely left the house. I caught COVID in April 2022. I was lucky that my symptoms weren’t too bad - I had a sore throat and minor cough. The biggest disruption though was my sleep.
I'm also lucky in that I can sleep anywhere, any comfort, with any noise. Sick or well, I sleep just fine. (usually)
The sore throat and cough didn’t affect my sleep directly, it was indirectly. The cough, although mild, did end up popping my ears so one night I woke up with an ear ache. But the main thing that would wake me up: almost every night with COVID I had the weirdest, most vivid dreams. One particular dream was my dog attacking me and acting rabid - still to this day it is in the list as one of my worst dreams, and one of those I’ll never forget.
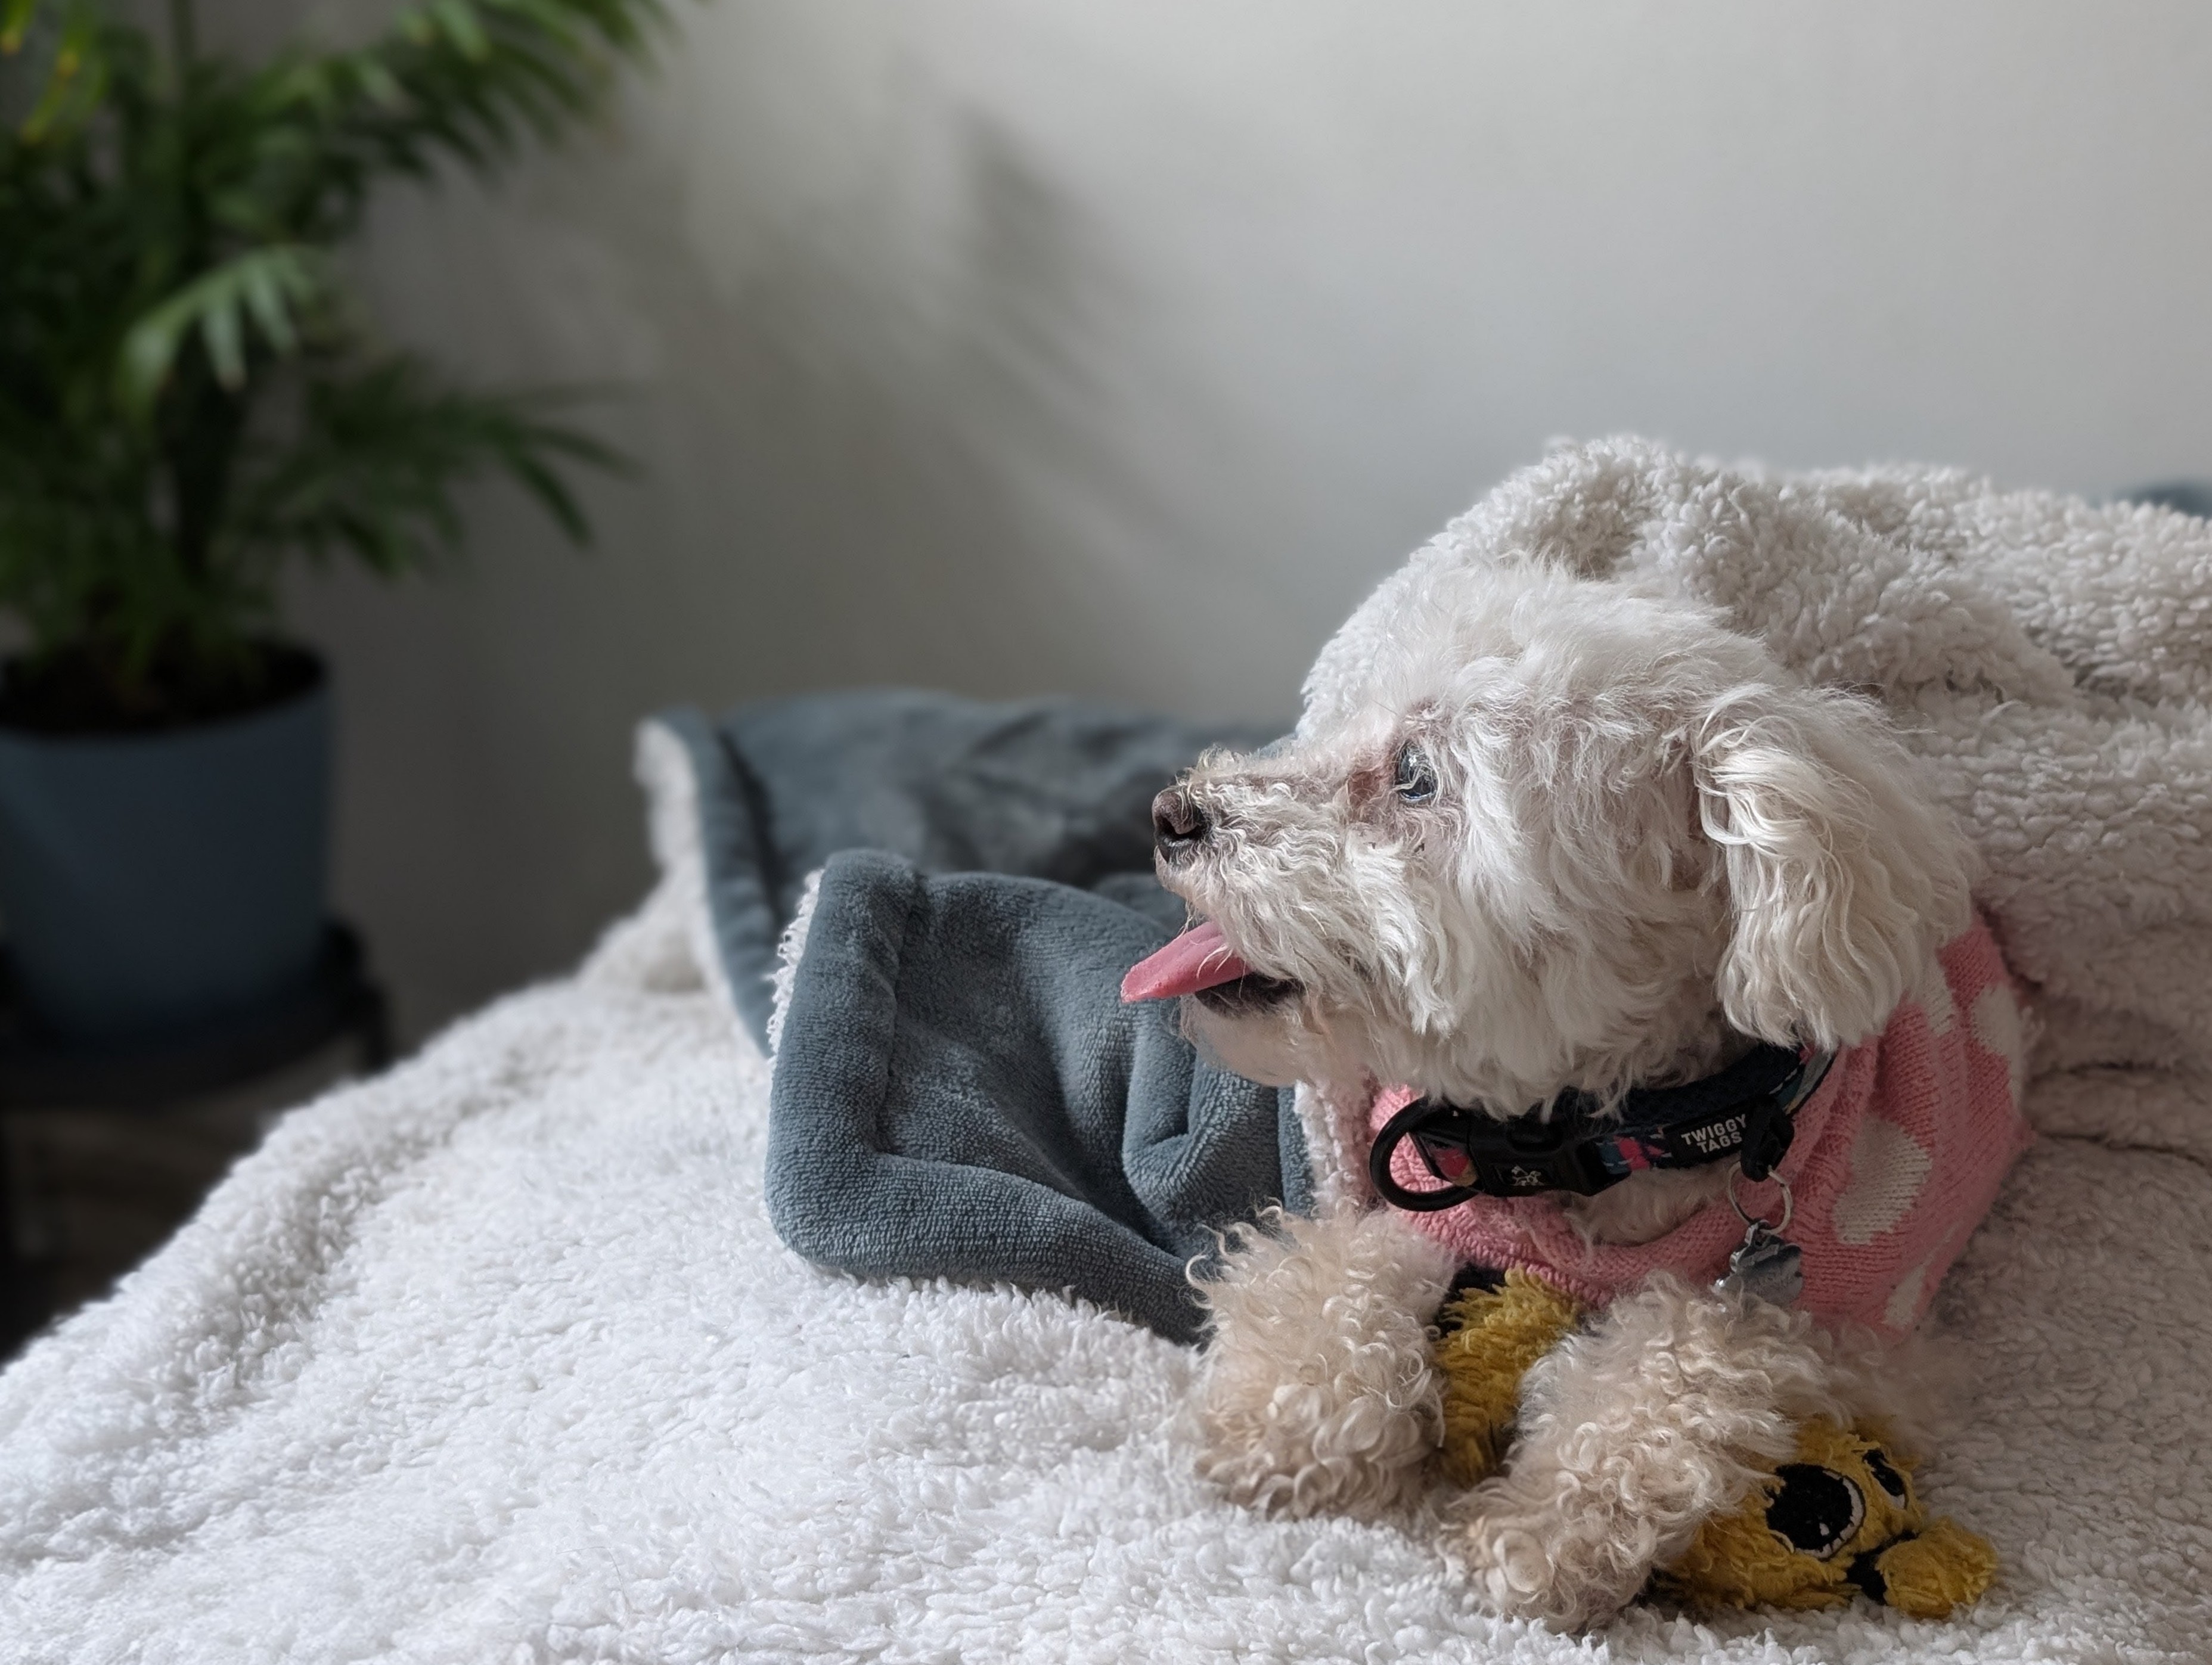
Photograph: For reference, this is Daisy.
This brings me to my experiment: is there a relationship between dreams and COVID?
The Work
I started by thinking how to investigate this… We already know that for some people, nightmares can occur more when ill (see NHS info) as the inflammation, fever, stress, sleep disturbance can affect dreams. This happens for me. But the COVID ones were beyond anything I experienced. I wondered if others also had significantly more crazy dreams when they had COVID.
A Poll
I started with a simple Poll. There were already some limitations: the question & answer bias, people only clicking on the poll link if they care about dreams, or perhaps they didn’t consider their dreams being out of the ordinary (and vice-versa).
When you had COVID, do you recall having dreams out of the ordinary?
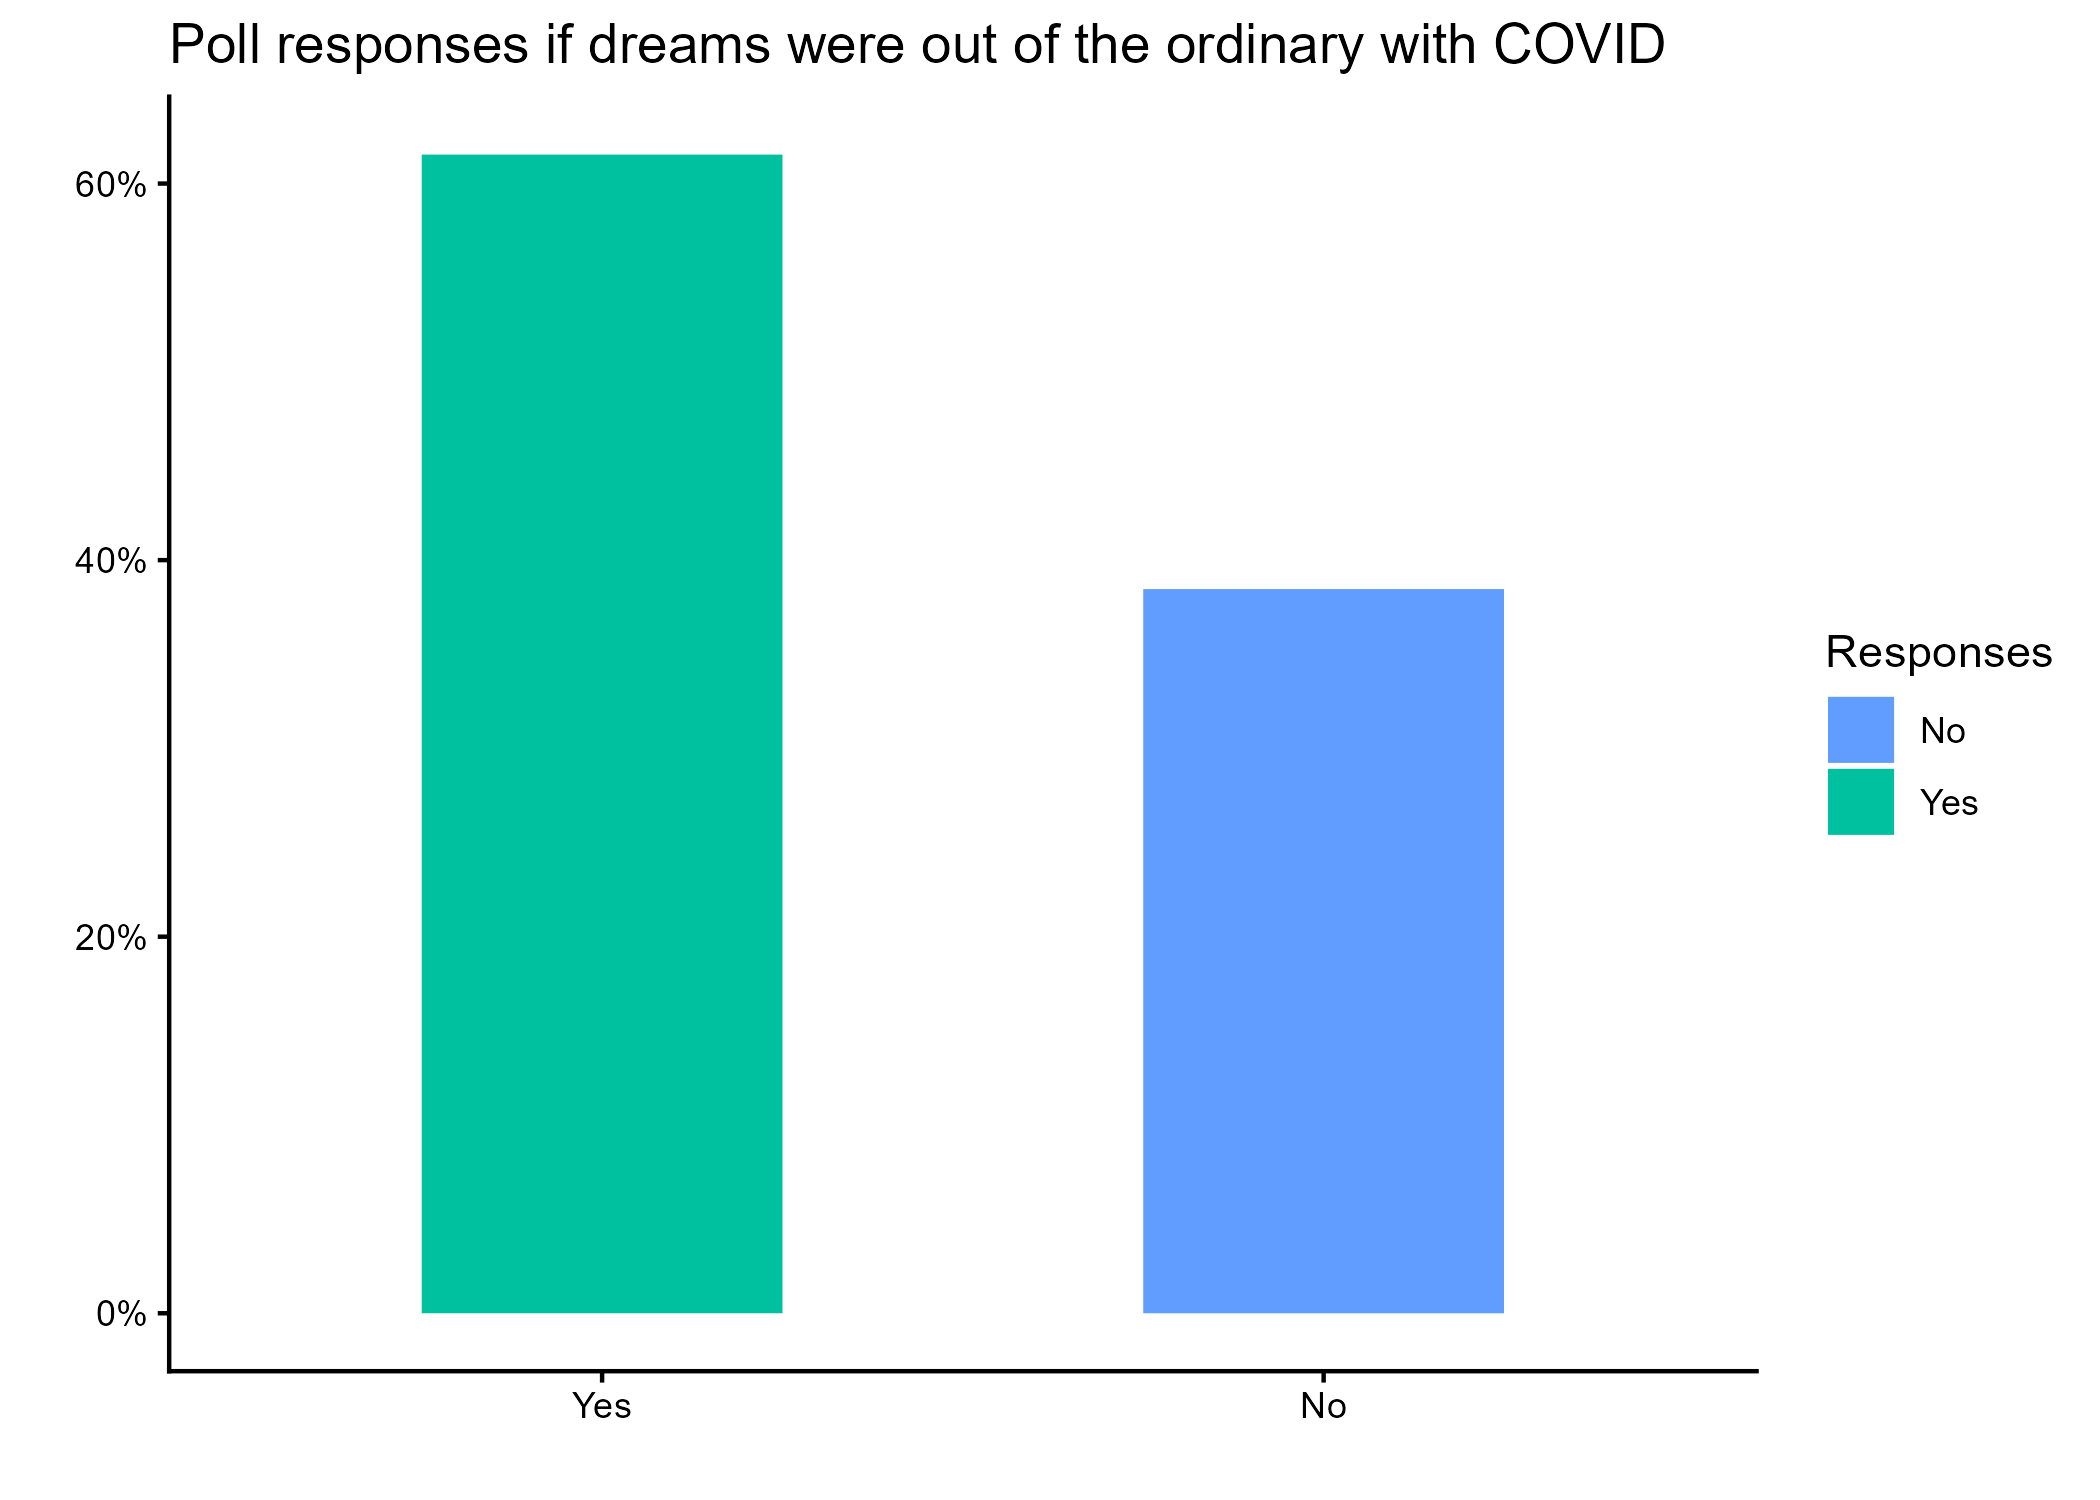
Figure: Bar plot of Poll responses.
As we can see, there are more “Yes” responses. I considered some statistical tests - like a binomial - but due to the small sample size, there wasn’t a significant p-value.
I had a bunch more ideas, I wanted to ask how people would describe these “out of the ordinary” dreams, or were the COVID dreams more different than other illness dreams. But more data would get into an ethical issue. So, I wondered what other data could I explore? Why not look at Google searches?
Google Trends
See code in the GitHub repository: covid-dreams.
To know if Google searches are interesting, we need a dataset to compare against. I started with COVID case counts. From OWID’s (Our World in Data) repositories, I downloaded the open COVID-19 data. I filtered rows for the United Kingdom and aggregated counts into a weekly format. This data was available from Jan-2020 to Apr-2021, so I used this timeperiod to filter other data.
I defined a list of terms to describe dreams:
dream_groups = {
    "Positive": ["Happy","Great","Good","Nice"],
    "Negative": ["Sad","Bad","Scary","Nightmare"],
    "Oddity": ["Wild","Crazy","Strange","Weird"],
    "Intensity": ["Vivid","Lucid"],
    }
To look a trending dreams, I used PyTrends, a Python library that interacts with Google Trends.
I searched for geographic geo=GB and cat=0 to include all categories.
This method has a few limitations. Google provides a sample of the actual search numbers, plus the data is not static and changed with recent activity.
Furthermore, using category 0 can introduce noise, e.g. people could search “a nice dream for the future” or “last month was a nightmare”.
When searching trends, all phrases had the term suffixed with “dream” e.g. “happy dream” (with the exception of ’nightmare’). I also queried for “COVID” itself. Phrases “silly dream”, “confusing dream”, and “intense dream” returned no results. Once I had the data for each dream type, I normalised it against COVID counts, and averaged them by group: Positive, Negative, Oddity, and Intensity. Here are the results:
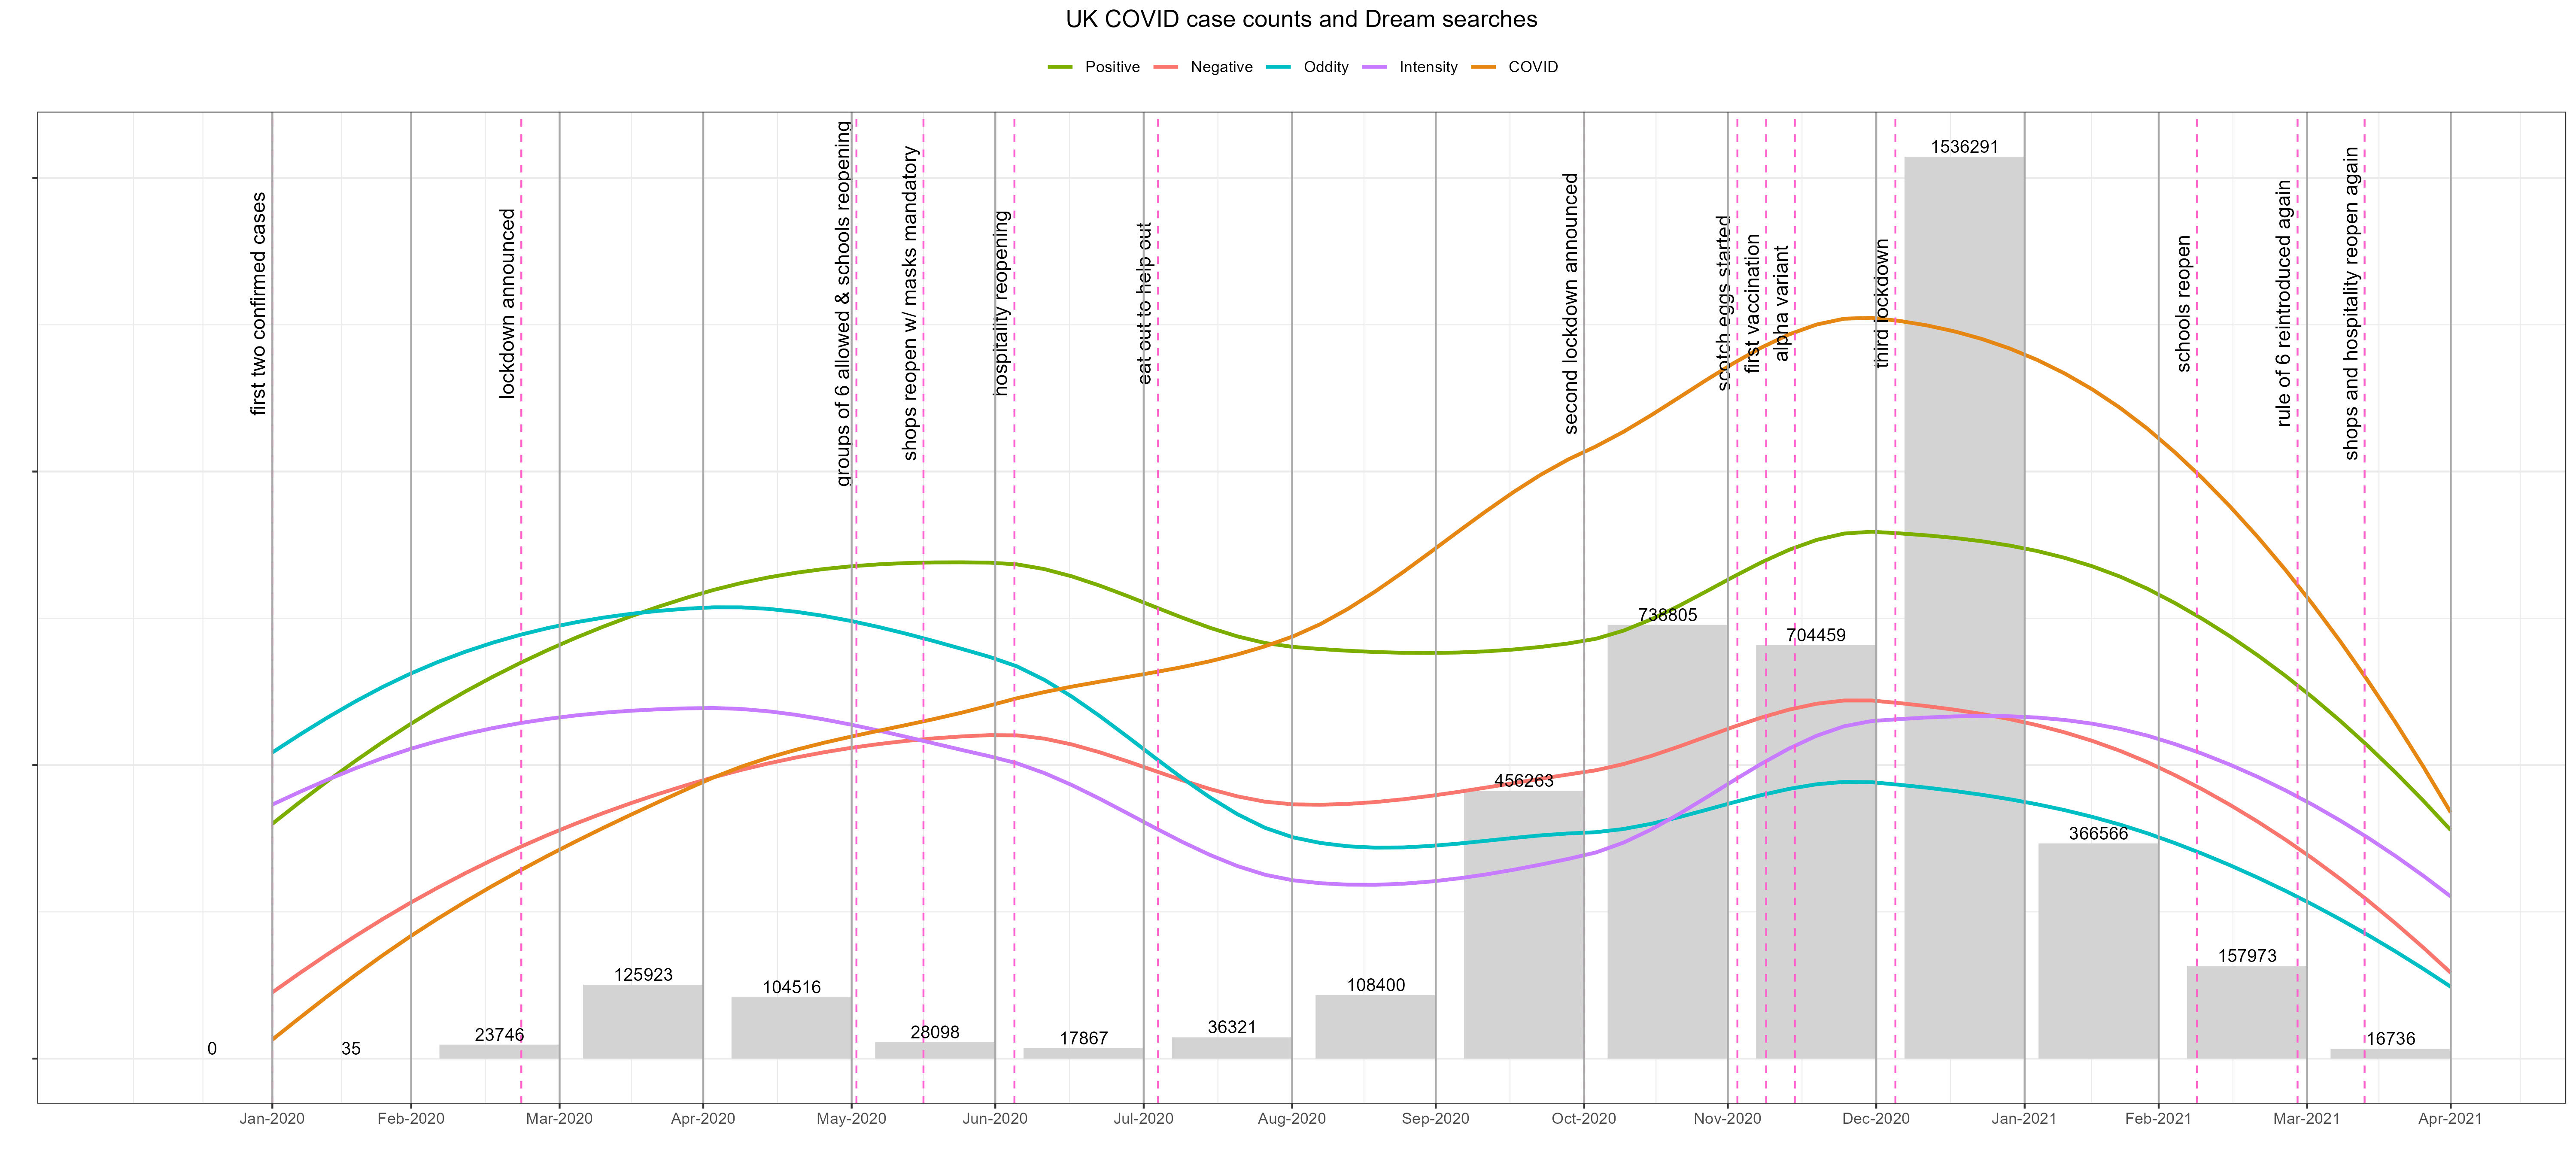
Figure: Bar plot of UK COVID counts and Google search trends. Bars highlight counts per end of month, coloured lines represent the search trends, and dashed lines are major events.
COVID searches (orange) and negative dream searches (red) both follow a similar pattern: they increase from January until June. Negative searches decrease after June - this may relate to restrictions easing. Although positive dream searches are a higher count, it does follow a similar pattern as negative throughout the year. Both dream types increase after a second lockdown was announced. Odd and intense dreams follow a similar pattern also yet increase before the other searches do.
As you can see from the correlation plot (below), the correlation coefficients (r) both highlight that COVID google searches correlate with case counts (r=0.79).
Both positive (r=0.64) and negative (r=0.59) dream types correlate with COVID, but odd dreams had little correlation (r=0.03).
Positive, negative, and intense dreams all correlate (r>0.5) with eachother, showing a similar pattern in the data.
Odd dreams is the “odd one out” and doesn’t really correlate strongly with the other variables.
| A | B |
|---|---|
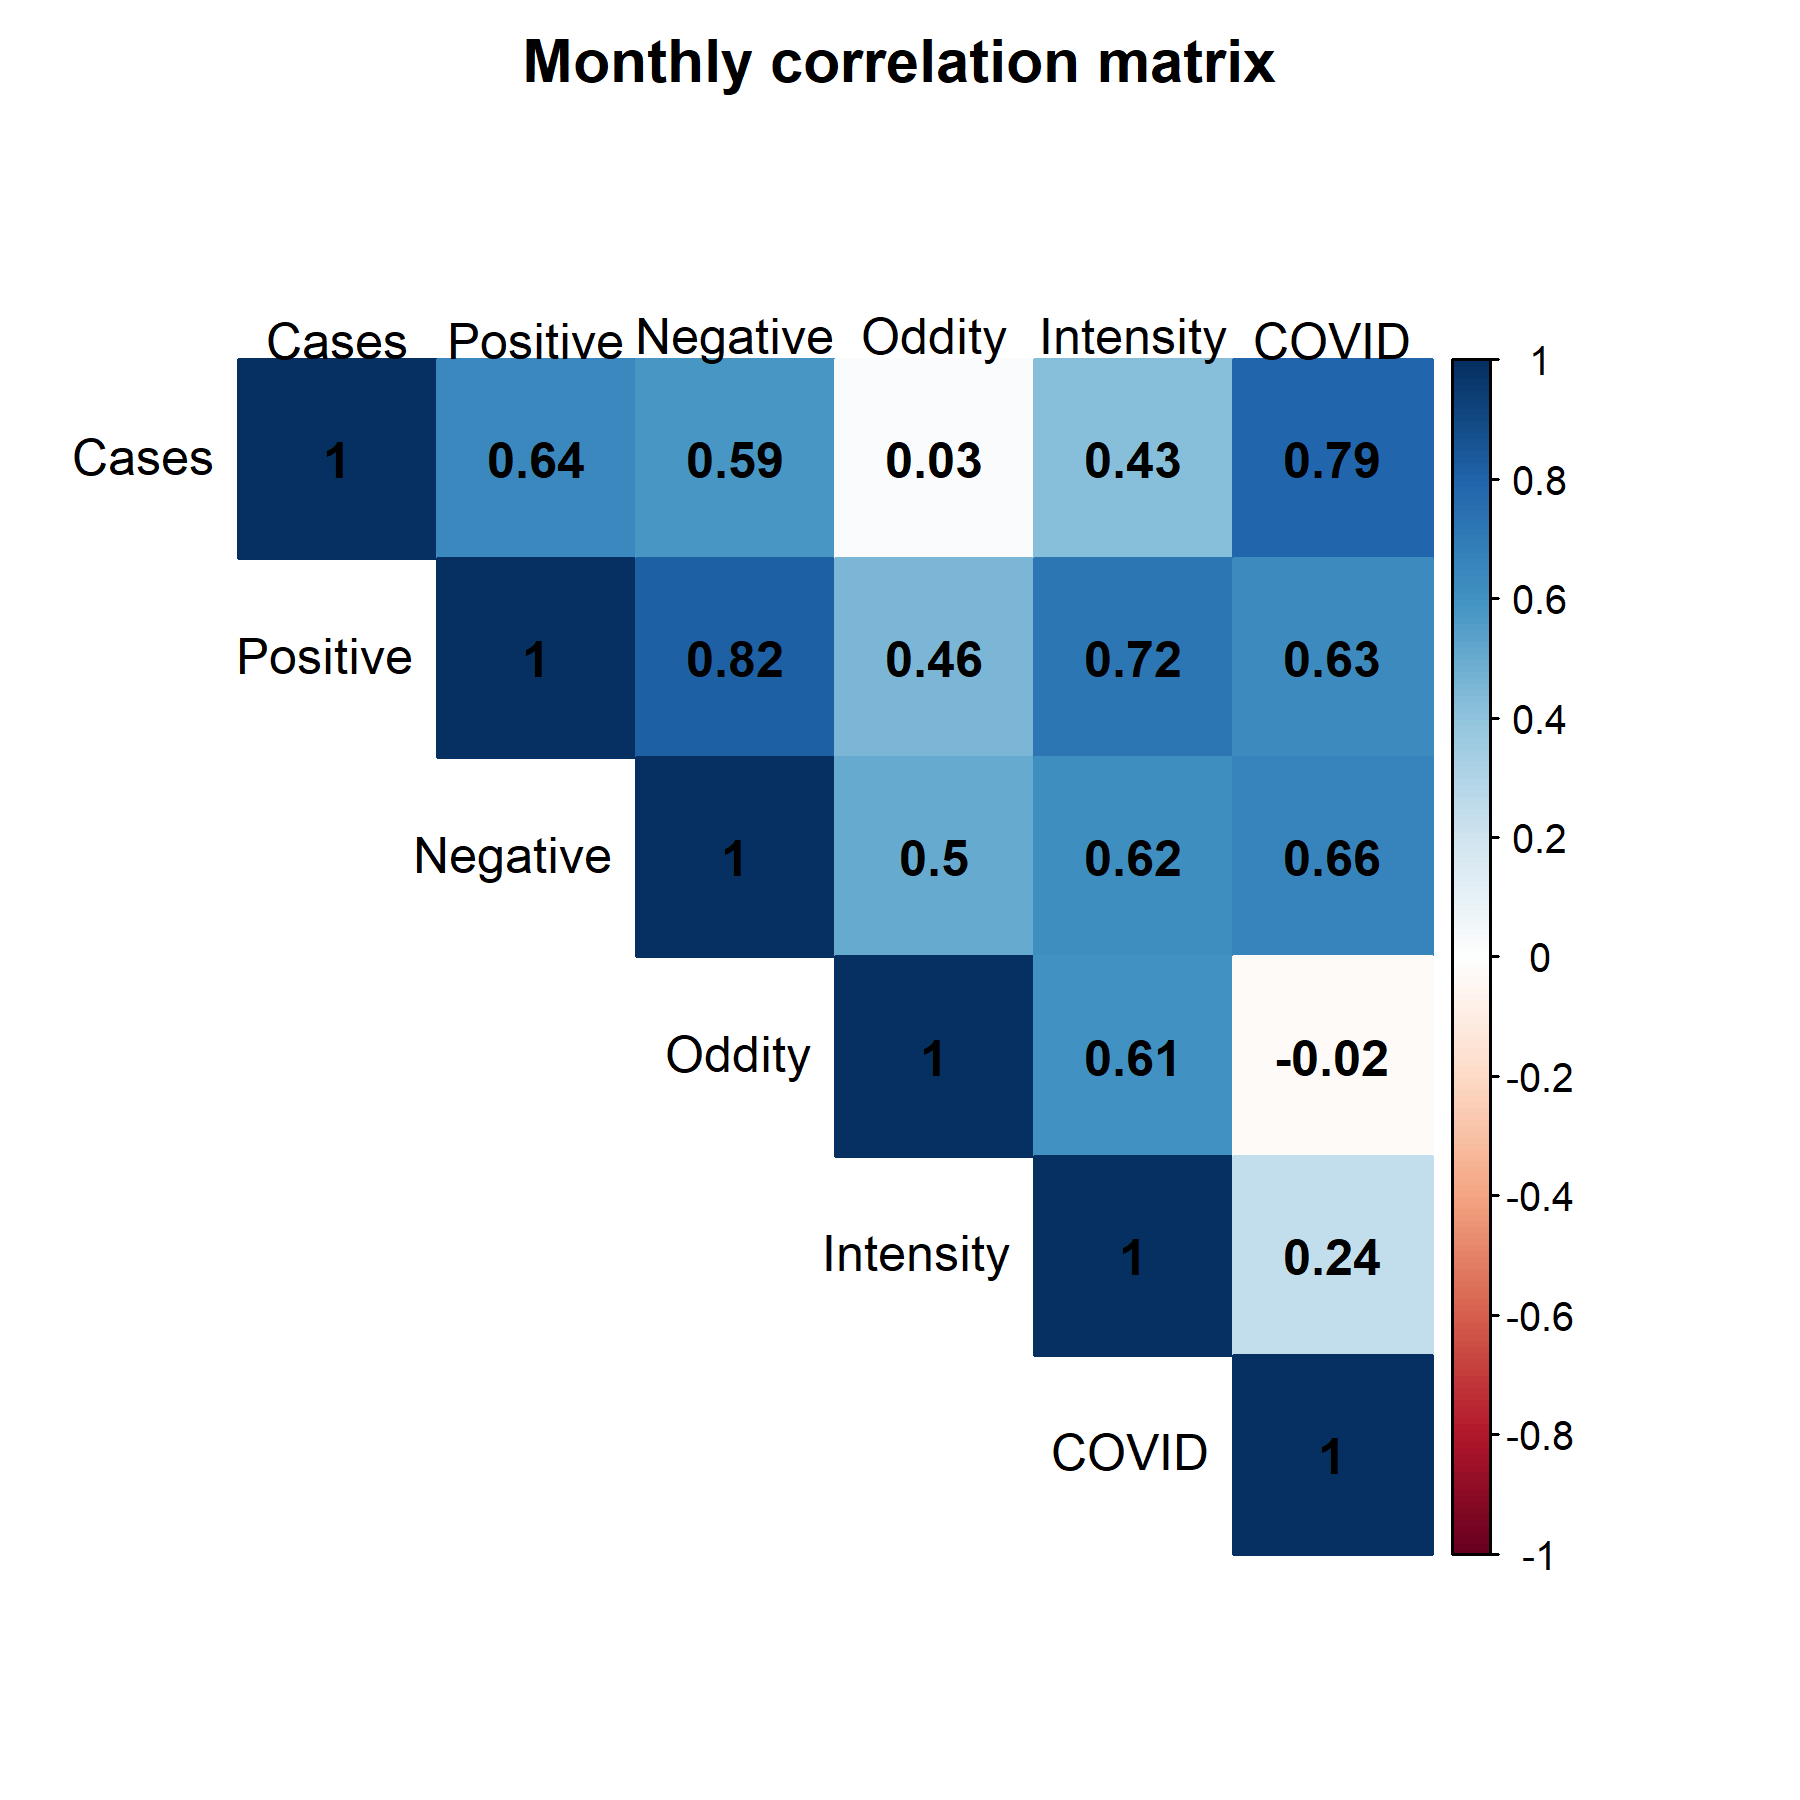 | 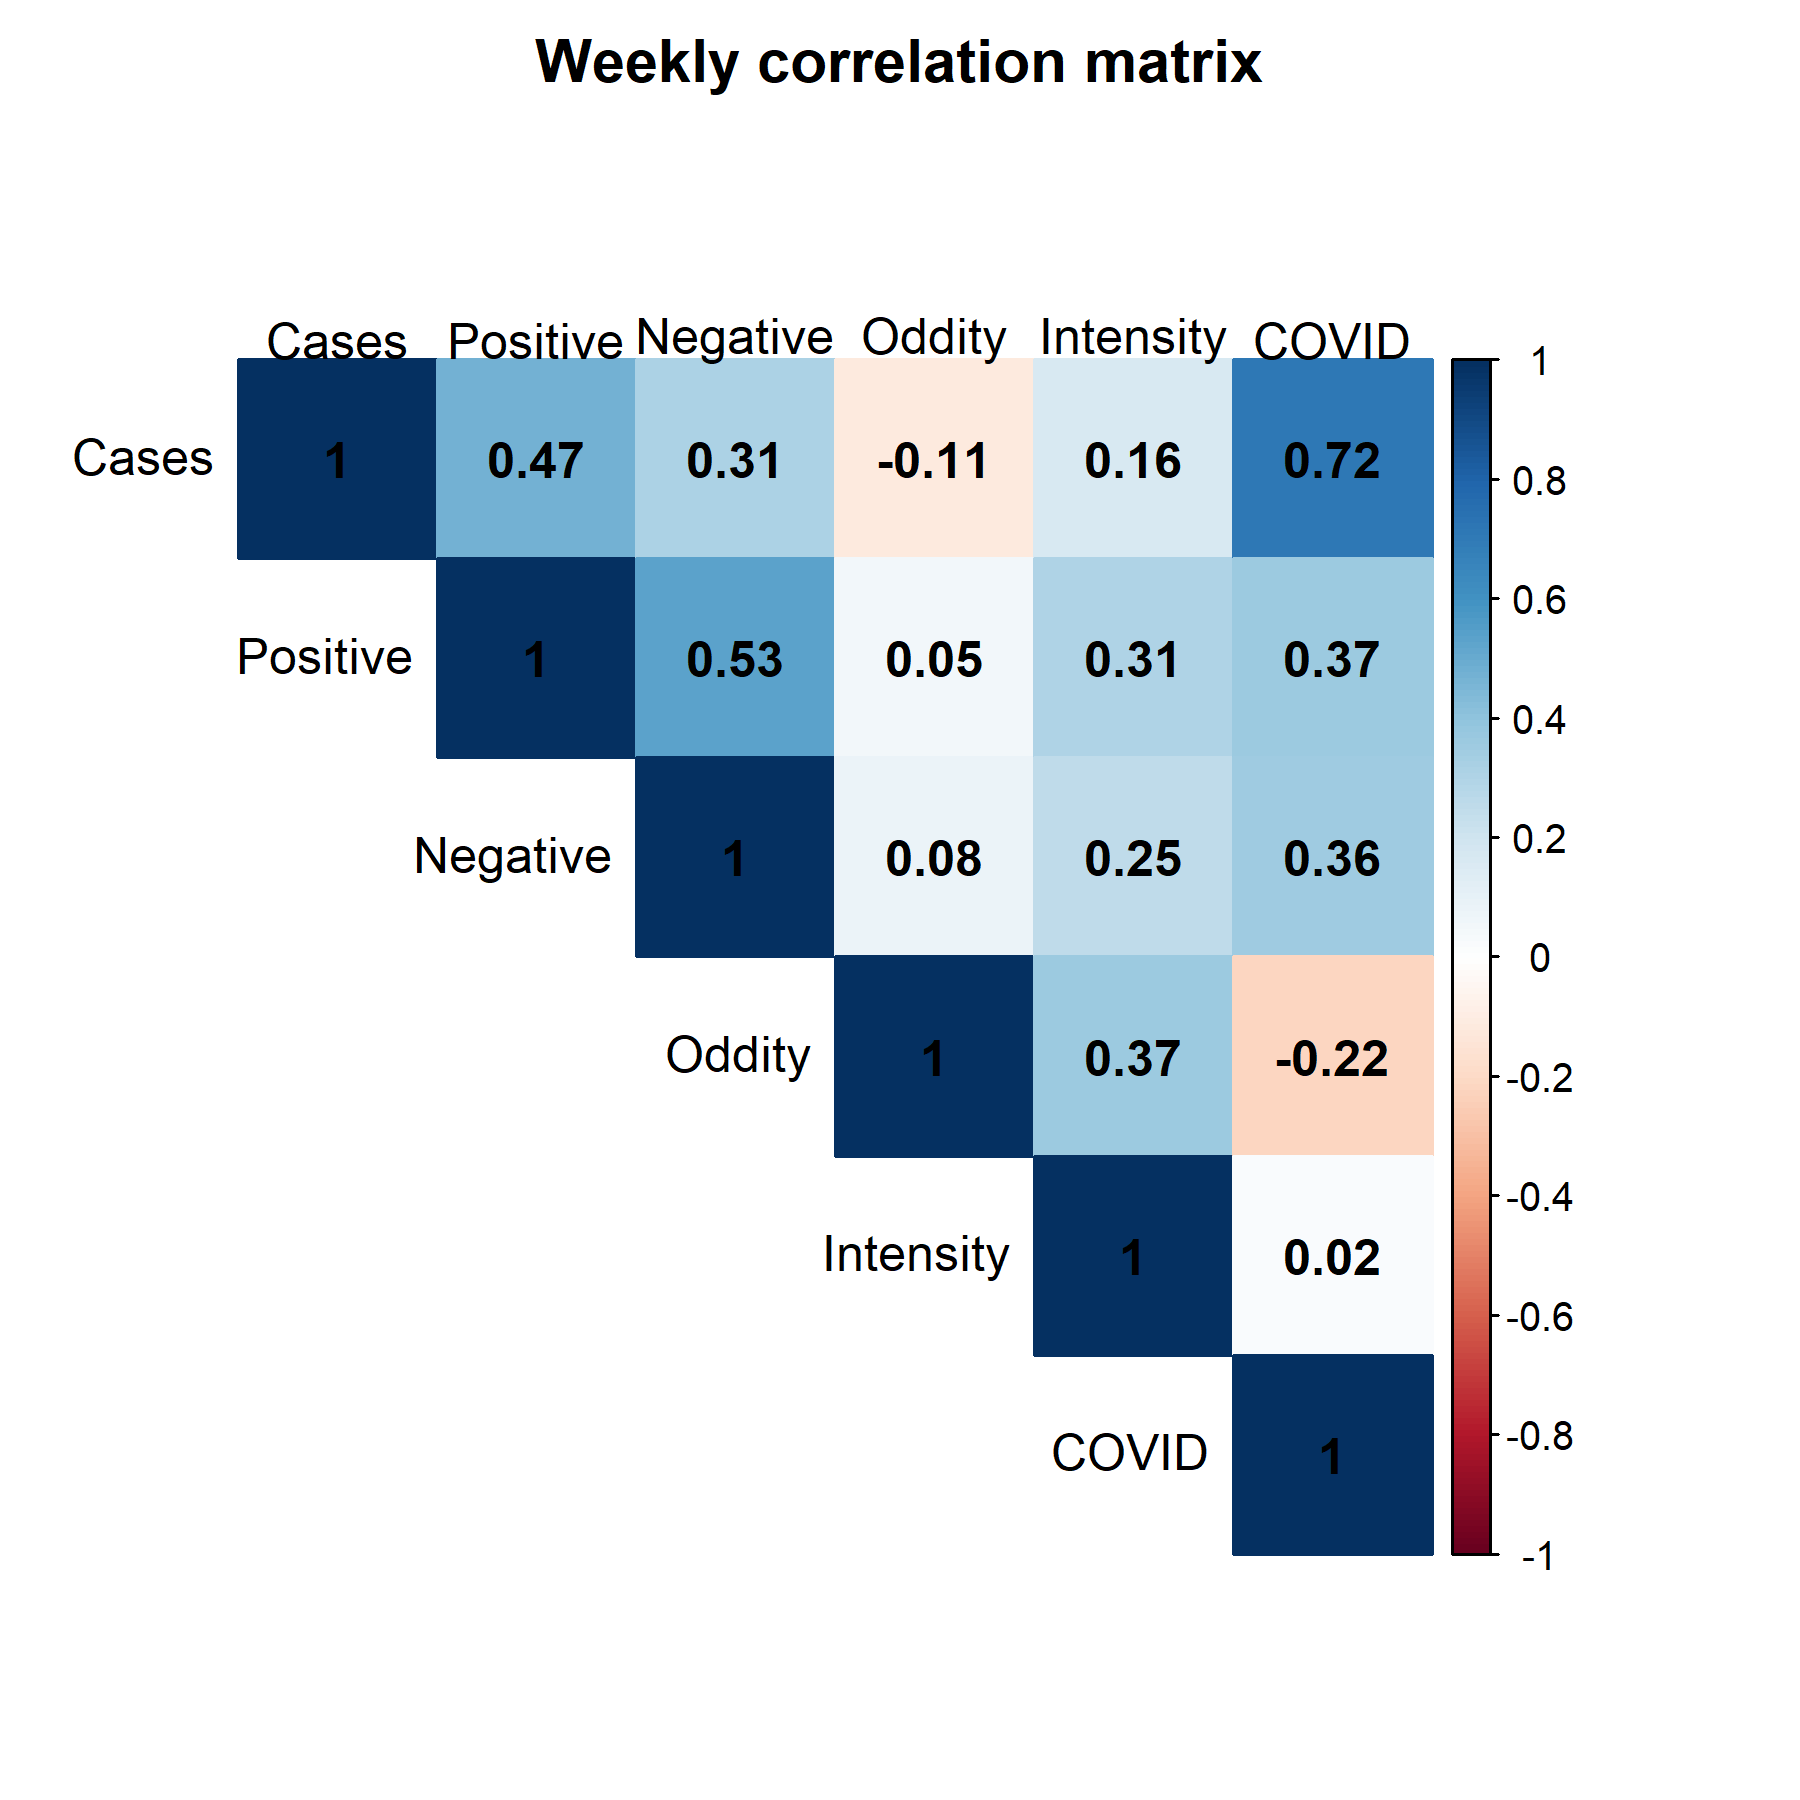 |
Figure: Correlation plot of data for (A) monthly and (B) weekly.
When analysing search trends against case counts, as expected COVID searches has a significant relationship (p<0.001).
Both positive and negative dreams also have an association with case counts.
Despite sampling differences (weekly vs. monthly) both odd and intense dreams have no significant relationship.
| Type | Test | Positive | Negative | Oddity | Intensity | COVID |
|---|---|---|---|---|---|---|
| Monthly | Correlation | 0.02 | 0.003 | 0.81 | 0.36 | p<0.001 |
| Weekly | Correlation | p<0.001 | p<0.001 | 0.58 | 0.13 | p<0.001 |
| Monthly | Linear Model | 0.01 | 0.02 | 0.92 | 0.1 | p<0.001 |
| Weekly | Linear Model | p<0.001 | 0.01 | 0.36 | 0.2 | p<0.001 |
Table: P-values of search trends against COVID case counts.
Statistical tests: multiple tests can solidify 'evidence' that a relationship is present. P-values help us understand if the relationship is due to chance or not. Small (typically p<0.05) suggest a meaningful association and so it is unlikely that it is random.
- Correlation: if two variables move together in the same direction and whether it is random.
- Linear model: if changes in searches are associated with COVID case counts, considering trends.
Baseline
After investigating trends during 2020 and initial case counts, I realised perhaps these trends are just common every year?
We need a baseline. As the COVID data was during Jan-2020 to Apr-2021, I chose a timeperiod of before Jan-2018 to Apr-2019 and after Jan-2022 to Apr-2023.
(of course we still have COVID in 2025, but I am using the term ‘after’ to indicate ‘after’ the first year of the pandemic)
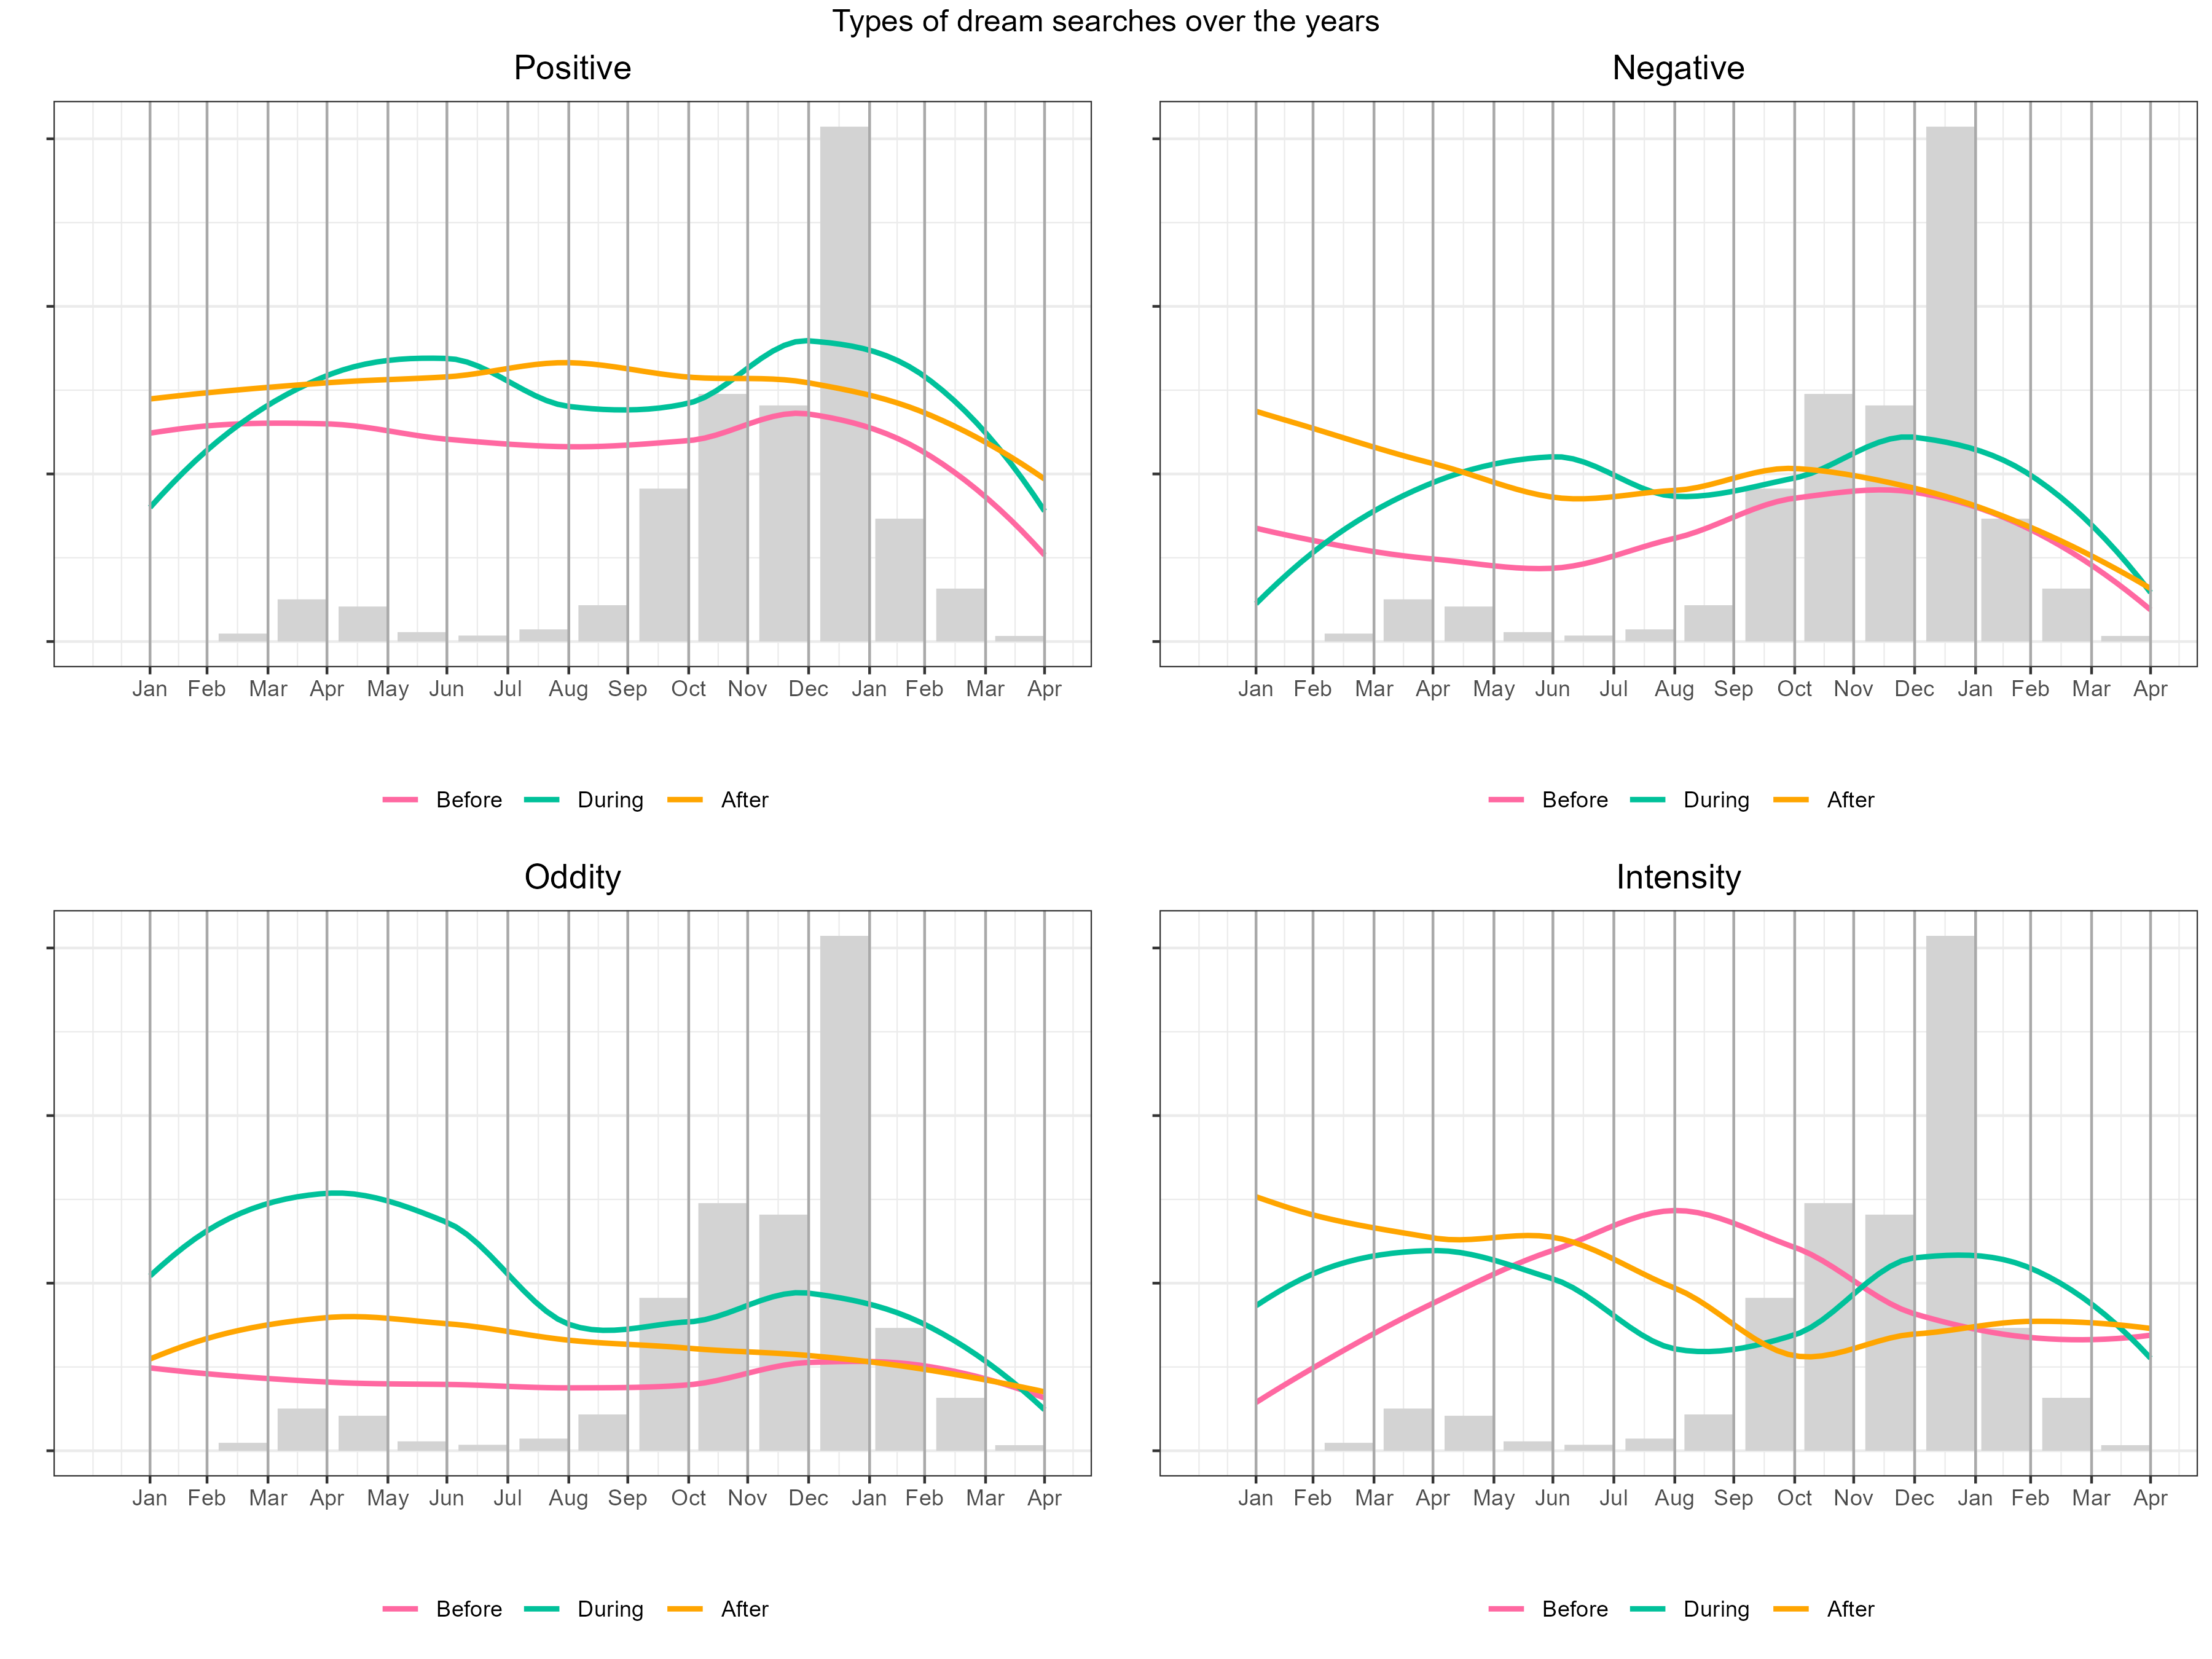
Figure: Line plots of dream searches over the year, coloured by timeperiod.
The Figure above is split into subplots, each representing a different dream trend with individual lines being the before, during, and after. At first glance, the during line for each are noticeably different compared to before and after lines and follow a wave-like pattern: during COVID, all dream types increase during those first few months (cases/lockdown), decrease during the summer (restrictions eased), and increase again during Autumn/Winter (cases/restrictions). Before and after lines for each are often more smooth and similar - with the exception of intense dreams.
The Table below highlights the results of various statistical tests for before and during timeperiods.
Odd dreams are the most consistent to have changed.
Positive and negative dreams do show some changes in weekly sampling over the years.
However intense dreams have no significant change.
All correlation coefficients (r) and p-values indicate no relationship across the years.
| Type | Test | Positive | Negative | Oddity | Intensity |
|---|---|---|---|---|---|
| Monthly | Binomial | 0.45 | 0.8 | 0.004 | 1 |
| Monthly | T-test | 0.04 | 0.05 | 0.001 | 0.75 |
| Monthly | F-test | 0.14 | 0.03 | 0.01 | 0.95 |
| Monthly | Correlation | 0.16 | 0.77 | 0.65 | 0.65 |
| Monthly | Correlation r | 0.37 | 0.08 | -0.12 | -0.12 |
| Weekly | Binomial | 0.04 | 0.004 | p<0.001 | 0.39 |
| Weekly | T-test | p<0.001 | p<0.001 | p<0.001 | 0.59 |
| Weekly | F-test | 0.28 | p<0.001 | 0.05 | 0.79 |
| Weekly | Correlation | 0.38 | 0.61 | 0.91 | 0.71 |
| Weekly | Correlation r | 0.11 | 0.06 | 0.01 | -0.05 |
Table: Statistics dream search trends before and during COVID.
- Binomial: whether there is a pattern in increases or decreases.
- T-test: if the before-and-after differences in the search trends are meaningful.
- F-test: similar to a t-test but looks at variability and checks consistency in trends.
- Correlation: if two variables move together in the same direction and whether it is random.
- Correlation (
r): if two variables are moving together over time and in what direction:r>0.5same direction,r<-0.5different directions,r=0(or close to) no similarity.
Conclusion
I sampled and analysed the data into weekly and monthly subsets. Monthly can reveal long-term patterns (seasonal), which we saw when lockdowns were announced and restrictions eased that searches for dreams changed. Weekly data can capture more granular trends and show real-time changes as most people have COVID usually have symptoms and recover within a few weeks (see NHS info).
From the analysis, odd dreams had the most significant change compared to the previous year (and next year). All dream types followed a different, wave-like, pattern compared to other years. During the year of COVID, positive and negative dreams had a strong association with case counts.
Perhaps dreams were “out of the ordinary”?
For me, the first year of COVID was a stressful and scary time, and I know others had a worse time than me. Although I didn’t have COVID until 2022 (essentially in the “after” group), I did have dreams that were “out of the ordinary” and the data suggested other people were curious about their dreams as trends correlated with case counts. Plus searches for odd dreams were significantly higher than the previous year. Again, this could conflict with other searches…
Overall, I think this shows there is a collective experiences. Just like symptoms though, we don’t all experience the same with COVID and so it is expected that some didn’t have unusual dreams. But we can see trends.
Of course I would love to search deeper into this, but without research money, resources, and limited evening hours… I like to think this was a thorough informal experiment. A small side-project that can highlight interesting patterns.
Final note: thank you to all those who contributed to the Poll! :-)