Dr Samantha Pendleton
Clinical Informatician
Engineer of data, ontologies, and clusters. Thrower of pots, controllers, and eggs.
My first Bioinformatics experience
tl;dr: see the research poster.
Introduction
Preface: Bioinformatics covers a wide range of areas, e.g. developing complex algorithms to answering complex questions.
Aberystwyth University advertised a position for a Summer research position in Bioinformatics. I always had an interest in Biology, yet slightly worried as I didn’t have much scientific coding experience, but I was more than willing to learn.
“An analysis of current state of the art software on nanopore metagenomic data”.
A research team collected DNA sequences from mines in order to show the ability of sequencing without valuable resources and in the field. They used a new sequencing method, Nanopore, which sequences fast and recovers long reads (reads == sequence).
In preparation, I had help installing a Linux Mint partition for my Windows laptop so I can easily installing various code packages. I chose Mint as I’ve had experience with it during my undergraduate modules and the interface was most similar to Windows.
Week 1
For my first day, my supervisor, Amanda Clare suggested I read some papers about the sort of research that was conducted from the research team. The research was in a South Wales (UK) mine and DNA was extracted to study the Earth’s subsurface, where there is no internet, to find bacteria. Two datasets exist: the research team said the second results are better quality as improved protocols were used for DNA extraction.
Each dataset has a series of sequences/reads, which each read is a combination of ACGT codes.
Reads with more GC content (a base pair) in sequences are said to be more stable compared to AT: if repetitive AT it may indicate an error.
The first tool to use was Goldilocks. This was my first attempt of installing a Python package and so took some time figuring out.
With Goldilocks and other tools designed for short reads, we noticed that they needed to be updated for long reads.
However, we were able to observe areas of heavy AT base pairs. I had to use SAMtools for file converting as Goldilocks used indexed files.
I also looked into Poretools to recreate the nice histograms from the original paper: a personal success.
My supervisor, Amanda and I went to watch the Nanopore minION in action.
That first week was more draining than I thought. I had a bank of new terms which I didn’t fully understand, attempts to install packages, and imposter syndrome. But at the end of the week, I had plots and asked for help in understanding them.
Week 2
I have found out that the longest reads (via Poretools) were potential errors and the quality of the data was overall quite low.
However, for Nanopore this quality wasn’t necessarily bad.
The research team left the location after 50 minutes however continued running the data: the longest reads occurred after 50 minutes.
But those AT heavy reads were not the longest reads.
Week 3
I used the Linux command uniq to see there are no duplicate reads and investigated these heavy AT reads.
Interestingly, after using BLAST on one, the query cover was low though results included fungus and bacteria.
I once again attempted using Poretools with the data without MUX (not quality filtered) reads and the results were ever so slightly different.
I was having trouble with one of Poretools' plotting functions and noticed a Git issue, however the suggested fix was to avoid using the PIP installer…
Week 4
At the beginning of the week, I met with Amanda and she saw the report I started: we agreed to look more into a comparison of the datasets. After discussing with one of the researchers, Andre Soares, it was mentioned that the datasets were at different times of the year (v1: Dec 2016, v1: Apr 2017).
The aim of this week was to try and BLAST both datasets, but first I needed to set-up on the AU network cluster as these jobs will be too heavy loaded for my personal laptop.
In the meantime, I ran some BLAST jobs on random reads from both datasets: specifically, the long reads which weren’t AT heavy, plus some that were shorter.
Data v1 had nothing really to report, however v2 had bacteria, bacteria that thrives in 40+ degrees - quite unusual as the mine was 15-20 degrees.
Week 5
I was finally connected to the cluster and ran the BLAST jobs.
Data v1 had barely any very low query cover with random species: peppers and piranha.
However, v2 had ~800 different types of bacteria within the subsurface.
I had another opportunity to visit the lab as I was invited by the creator of Goldilocks, Sam Nicholls.
Sam was conducting wet lab work for his PhD and I watched him conduct PCR and performed DNA gel extraction, then taking pictures under UV light.
Turns out, the UV light, although captures the DNA, also degrades the DNA quality so it needs to be a quick procedure.
Week 6
So this was the final week to wrap-up the summer research project. As a final task, I looked into the tool, Pavian, to create hierarchy tree diagrams from the BLAST results. However, I wasn’t able to pursue much with Pavian as I ran out of time and was not able to create any diagrams.
Wrapping-up
To finalise, I developed a poster to present at the BCS Mid Wales “Show & Tell” event. With less than 24 hours notice, I was also asked to prepare a 5-min presentation, which I enjoyed my first experience presenting a research project! I also presented my poster to the Aberystwyth Bioinformatics lab, where we discussed how some tools for short reads aren’t designed to handle long reads.
I would like to thank my supervisor Amanda Clare for the fun opportunity and researcher Andre Soares for the help and discussions about the data.
Also thank you, Sam Nicholls, the developer of Goldilocks, for helping me!
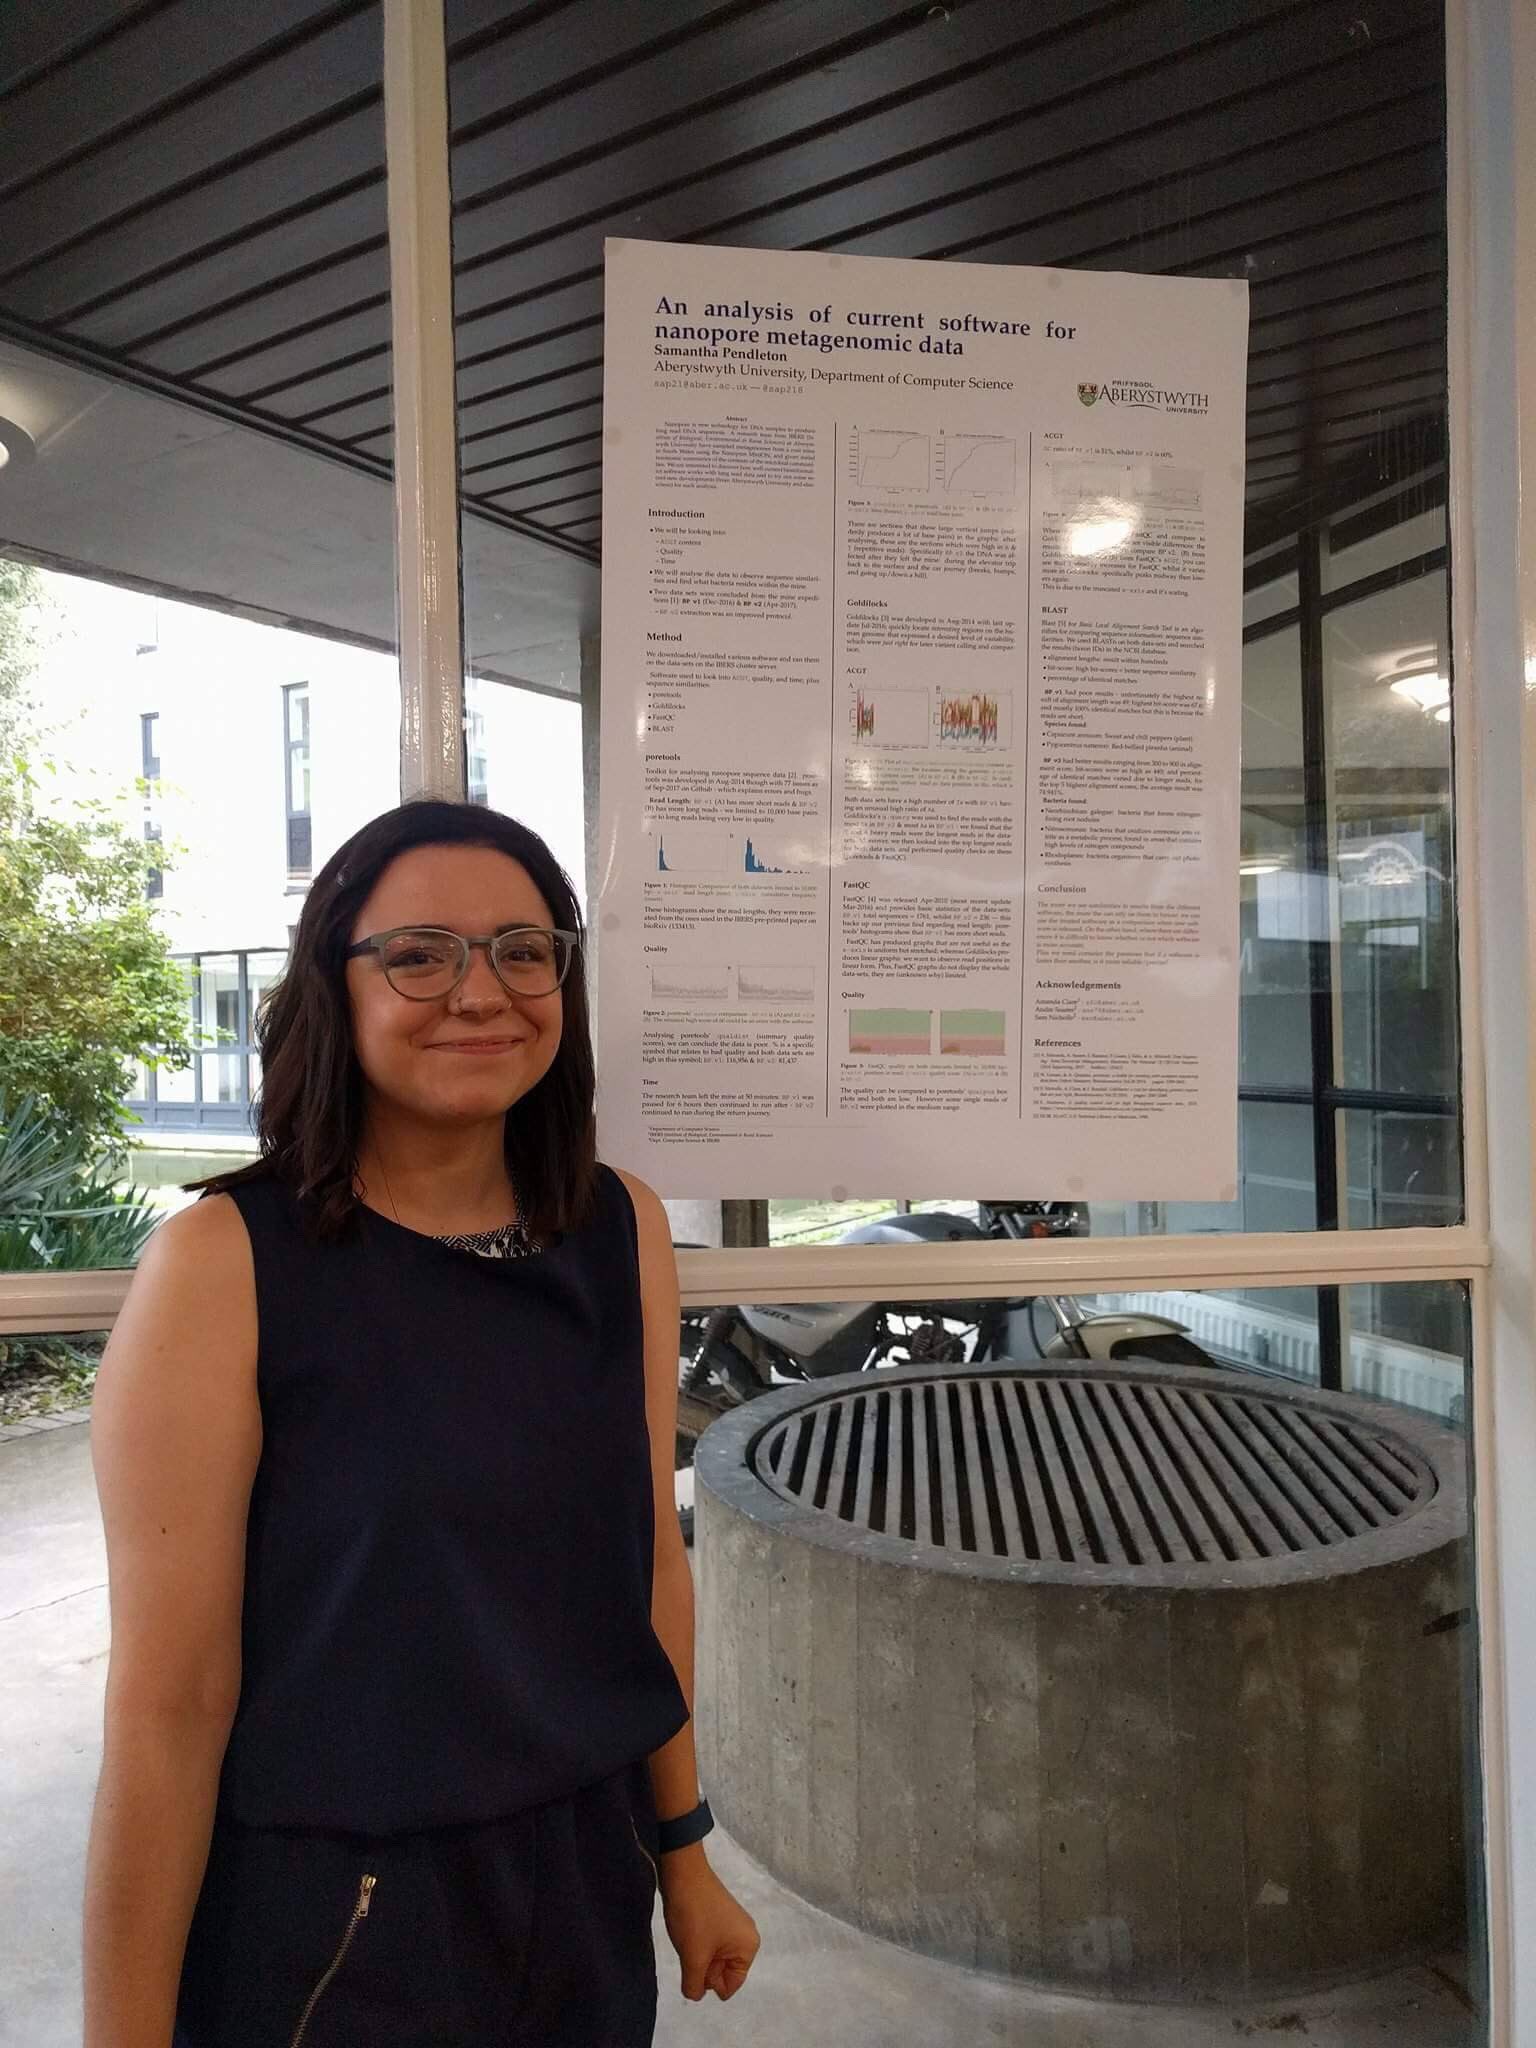
Photograph: Presenting my poster.